 Across a number of research projects at Cranfield University, we consider the societal consequences of a range of potential future climates – for example on our critical infrastructure and housing. To do this we draw on the predictions of the UK Climate Projections (UKCP09). The UKCP09 datasets represent the fifth generation of climate change information for the UK, and are made freely available to the research community. To access the datasets, you first need to create an account. Datasets are then made available either interactively through a ‘user interface’ for single points, or via pre-processed Comma Separated Value (CSV) text files downloaded for a range of predetermined outputs and scenarios.
When we wish to visualise these datasets, perhaps as part of an adaptation study considering spatial impacts of the future climate, we need to be able to extract the data from the UKCP09 files to make it loadable into a GIS. This challenge provides us a good excuse for a short article in the use of the powerful ‘Perl’ scripting language with a worked example.
Across a number of research projects at Cranfield University, we consider the societal consequences of a range of potential future climates – for example on our critical infrastructure and housing. To do this we draw on the predictions of the UK Climate Projections (UKCP09). The UKCP09 datasets represent the fifth generation of climate change information for the UK, and are made freely available to the research community. To access the datasets, you first need to create an account. Datasets are then made available either interactively through a ‘user interface’ for single points, or via pre-processed Comma Separated Value (CSV) text files downloaded for a range of predetermined outputs and scenarios.
When we wish to visualise these datasets, perhaps as part of an adaptation study considering spatial impacts of the future climate, we need to be able to extract the data from the UKCP09 files to make it loadable into a GIS. This challenge provides us a good excuse for a short article in the use of the powerful ‘Perl’ scripting language with a worked example.
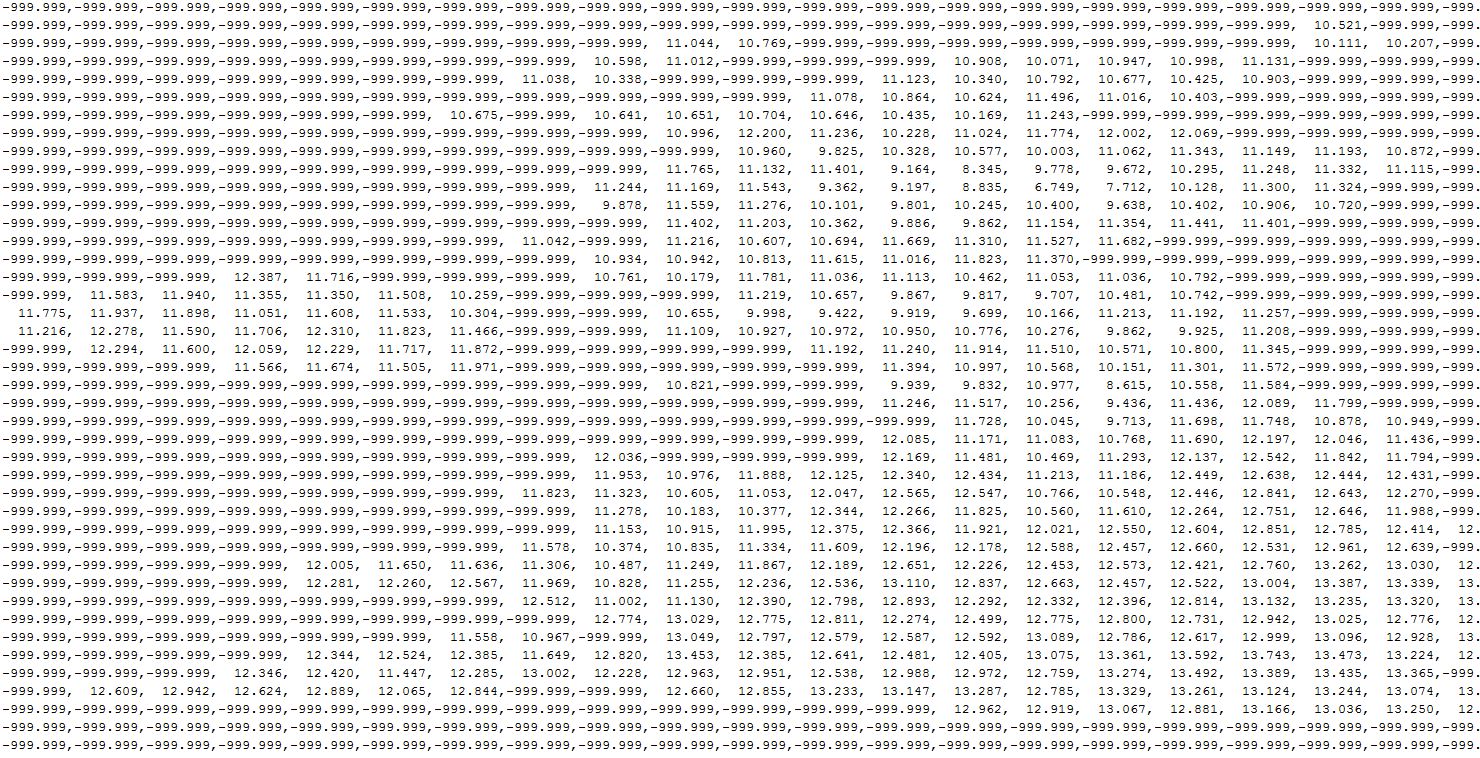 The UKCP09 data includes a set of ‘spatially coherent projections’ (SCP) that allow consideration of climate change across more than one location. Data for some 11 scenarios (‘plausible snapshots’) are made available from the CSV archive. One of the several data formats available provides projected values expressed on a 25km x 25km grid, each grid point having a unique identifier number. Thus one might download 11 data CSV files, each containing the data points, by grid identifier, for one of the scenarios. In a given file (e.g. ‘PrLnd_Abs_Tmax_Med_2080_Mar_SCP_Scen3.csv’), there are values, for the ‘actual maximum temperatures expected in March 2080 under medium emissions for scenario 3 of 11’. If you squint at the image here of the text file you can see the UK outline. The values are the actual projected temperature values (in this case).
 Parallel to this and stored in another file, available from the UKCP09 Grids page, data locational information is provided in a number of formats. For example, the downloadable file ‘grid_box_ids_with_mask.csv’ is a plain text file having the grid identifier numbers in a matrix of rows and columns. Again, if you squint at the image here you can see the UK outline – Wales most clearly.
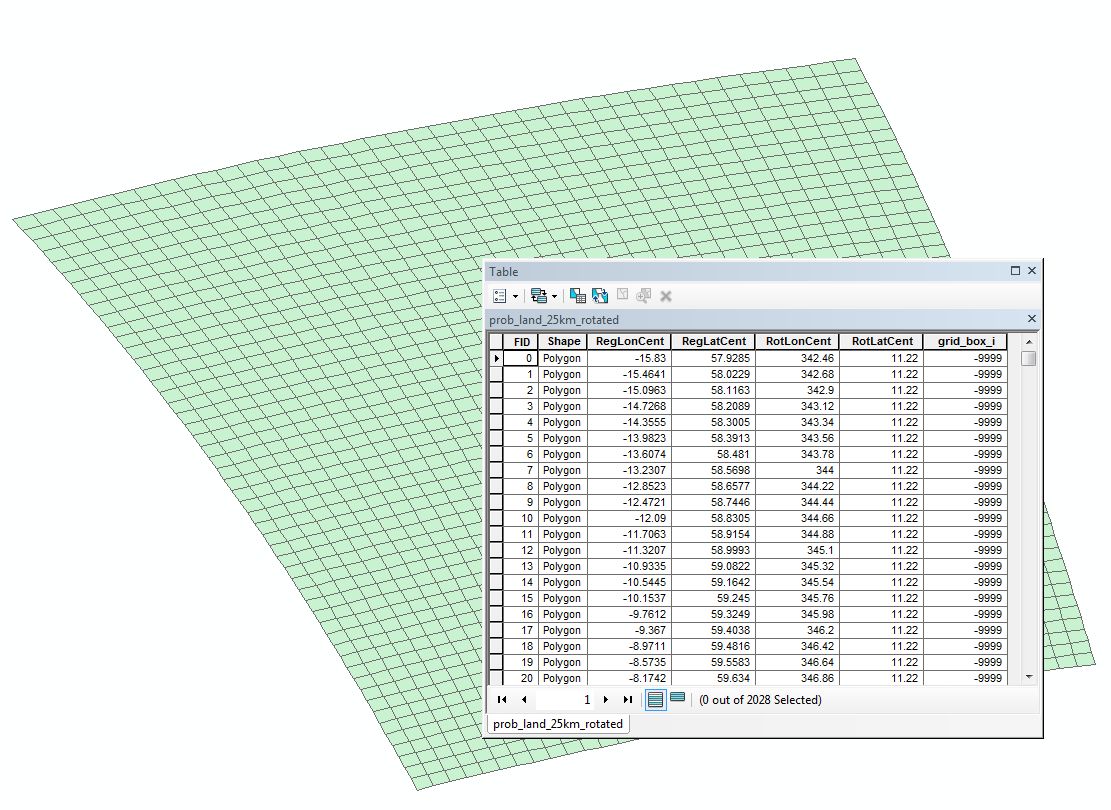 The grids are also provided in a separate GIS Shapefile that allows the interaction of the data in the GIS. Each polygon (grid square) has an attribute property of its identifier.
So far so good! The challenge, however, is to link all the values from the scenario files, to their appropriate grid identifiers, so that the file can be loaded into the GIS and the values mapped correctly – this is where Perl comes in. Perl is a highly capable, feature-rich programming language with over 25 years of development. Available freely there are versions for Linux, Mac and Windows alike. If you use MS Windows and want Perl, we suggest you download the Active State version.
Next we need to write a Perl script. Presented below is a script that takes, on the command line, a number of input data files as described, and mashes them with the gridfile, then outputting the whole into a new file ‘UKCP09_25K.txt’.
The grids are also provided in a separate GIS Shapefile that allows the interaction of the data in the GIS. Each polygon (grid square) has an attribute property of its identifier.
So far so good! The challenge, however, is to link all the values from the scenario files, to their appropriate grid identifiers, so that the file can be loaded into the GIS and the values mapped correctly – this is where Perl comes in. Perl is a highly capable, feature-rich programming language with over 25 years of development. Available freely there are versions for Linux, Mac and Windows alike. If you use MS Windows and want Perl, we suggest you download the Active State version.
Next we need to write a Perl script. Presented below is a script that takes, on the command line, a number of input data files as described, and mashes them with the gridfile, then outputting the whole into a new file ‘UKCP09_25K.txt’.
# Process_UKCP09_25K_Grids.pl
# Purpose: Process the UKCP09 25K datafiles to combine the data
# files with the appropriate grid Id.
# Run on cmd line as: perl Process_UKCP09_25K_Grids.pl *inputfiles*.csv
# eg for Summer TMax
# perl Process_UKCP09_25K_Grids.pl ..\PrLnd_Abs_Med_2080_SCP_ALL-Var_ALL-TempAv_ALL-Scen\PrLnd_Abs_Tmax_Med_2080_Sum_SCP_Scen1.csv ..\PrLnd_Abs_Med_2080_SCP_ALL-Var_ALL-TempAv_ALL-Scen\PrLnd_Abs_Tmax_Med_2080_Sum_SCP_Scen2.csv
# Setup
open(INFILE_GRIDS,"grid_box_ids_with_mask.csv") || die "Could not open 'grid_box_ids_with_mask.csv' file: $!";
open(OUTFILE,">UKCP09_25K.txt") || die "Could not create 'UKCP09_25K.txt' file: $!";
print "Starting ...\n";
$lineNumber = 0;
$dataHeaderLines = 70;

#header
print OUTFILE "Grid_Id";
foreach my $fn (@ARGV) {
  my $char = '_';
  my $n = 2;
  $fn =~ /(?:.*?$char){$n}/g;
  $col = substr $fn, pos($fn);
  $col =~ s/\..*+$//;
  print OUTFILE ",",$col;
}
print OUTFILE "\n";

while (defined($eachGridLine = <INFILE_GRIDS>)) {
  chomp($eachGridLine);
  @eachGridLine = split (/,/, $eachGridLine);
  $lineNumber++;
  for( $i = 0; $i <= @eachGridLine-1; $i++) {
    if (defined($eachGridLine[$i]) && $eachGridLine[$i] ne '' && $eachGridLine[$i] ne '-9999') {
	  printf(OUTFILE "%s", $eachGridLine[$i]);
      foreach my $fn (@ARGV) {
        open (INFILE_DATA, $fn) || die "Could not open $fn: $!";
		while (defined($eachDataLine = <INFILE_DATA>)) {
		  next unless ($. > $dataHeaderLines + $lineNumber); # skip through datafile to correct line
		  chomp($eachDataLine);
          @eachDataLine = split (/,/, $eachDataLine);
	      $eachDataLine[$i] =~ s/^\s+//; # left trim
		  $eachDataLine[$i] =~ s/\s+$//; # right trim
		  printf(OUTFILE ",%s", $eachDataLine[$i]);
		  last; # once have data exit
		}
        close INFILE_DATA;
      }
	  printf(OUTFILE "\n");
    }
  }
}
close INFILE_GRIDS;
print "... Finished\n",$lineNumber, " lines processed. File output to 'UKCP09_25K.txt'";
Perl is a compact, elegant language that can be rather obtuse and frustrating to learn. Immensely powerful operations can be undertaken in very few, even one line(s) of code. Of interest here is the outer loop that steps through the single INFILE_GRIDS file, and then for each grid identifier, a search is made sequentially through each INFILE_DATA file in turn. The results are gathered up and the printf command used to output the formatted result to the output file. The other point of note is the use of the ‘split’ command that breaks down the comma separated values into members of an array – allowing subsequent indexed access to the array members.
The output data has the following format shown below. After the header, the first data column is the grid identifier and then the subsequent columns contain the data items from each of the input files passed to the script – here there are two input files that have provided two corresponding output data columns. In fact, one can pass in huge numbers of input data files to the Perl script, which would simply adds on that number of columns of data after the grid identifier.
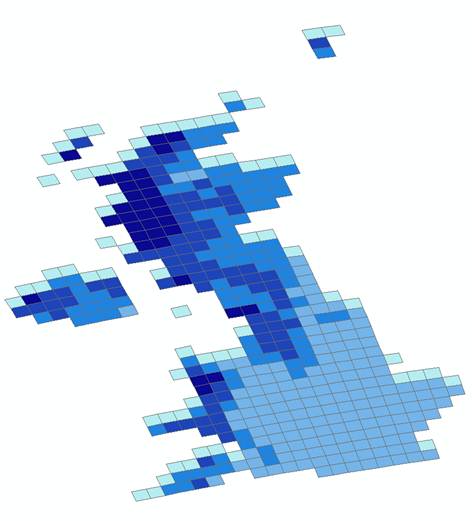
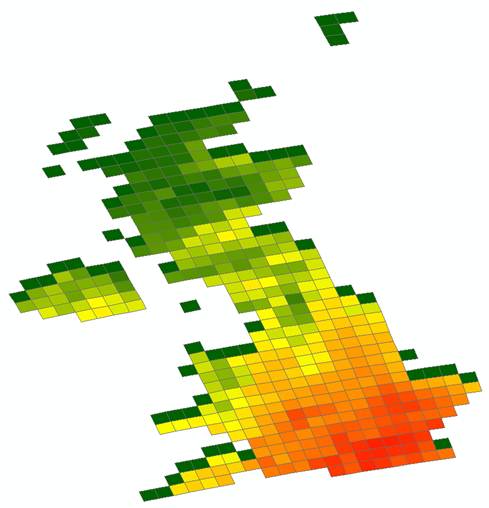
Grid_Id,PPTScen1,PPTScen2
76,-999.999,-999.999
114,2.434,2.326
153,1.980,1.930
Once we have this file, it is then a relatively easy task to load this into the GIS A relational join is made of the grid identifier in the Perl output file, with the corresponding grid identifier in the shape file noted above. Once that has been done, we can produce maps from the data and so then start to interact the data with other GIS datasets as part of the climate change adaptation study.
 Processing datasets together like this is a common task in data intensive reseach. Perl is one of many possible approaches that can be used (Python being another obvious choice), but it is a very powerful scripting language (if not the easiest to learn!).]]>