Node-RED and the Internet of Things

Here at Cranfield University we are putting in place plans related to the new ‘Living Laboratory’ project, part of our ‘Urban Observatory’. This project sits within the wider UKCRIC initiative, across a number of universities. Of the many experiments in development, we are gathering environmental data from IoT devices and building data dashboards to show the data and related analyses.

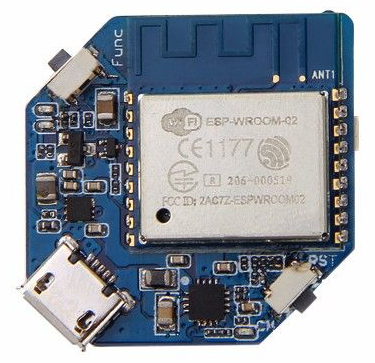
In this blog we investigate the use of Node-RED (https://nodered.org) as a programming tool for wiring together hardware devices, APIs and online services, using its browser-based editor to wire together flows using the wide range of nodes in the palette that can be deployed to its runtime in a single-click. Node-RED provides graphical programming tool for Node-JS that permits complex programs to be built pictorially with great ease. To undertake the project, we used a WIO Node device collecting temperature values, exposing these values via a web service, and the Node-RED receiving device being a Raspberry Pi.

Sourcing temperature data – the Wio Node

The Wio Node temperature sensor was described in an earlier blog here (http://www.geothread.net/voice-activated-wio-node-temperature-sensor). Temperature values are extracted via a web-based API call, with the REST URL taking the form, thus:

https://us.wio.seeed.io/v1/node/GroveTemp1WireD1/temp?access_token=TOKEN_GOES_HERE

The temperature values are then returned as a JSON string, appearing thus:

{"temperature":19.1800000000001}

Preparing the Raspberry Pi – installing Node-RED

To prepare the Raspberry Pi and install Node-RED, we first followed instructions to install Node-JS on the Pi at https://www.w3schools.com/nodejs/nodejs_raspberrypi.asp. Next we followed the instructions on the Node-RED site (https://nodered.org/docs/hardware/raspberrypi). In brief, we ran the Node-RED upgrade script:

bash <(curl -sL https://raw.githubusercontent.com/node-red/raspbian-deb-package/master/resources/update-nodejs-and-nodered)

We then set Node-RED to start automatically on boot, with:

sudo systemctl enable nodered.service

Running Node-RED

The Raspberry Pi was then rebooted. We were then able to start using the Node-RED editor (https://nodered.org/docs/hardware/raspberrypi#using-the-editor), calling the web-based interface with the URL (the IP address being that if the Raspberry Pi):

http://{the-ip-address-returned}:1880/

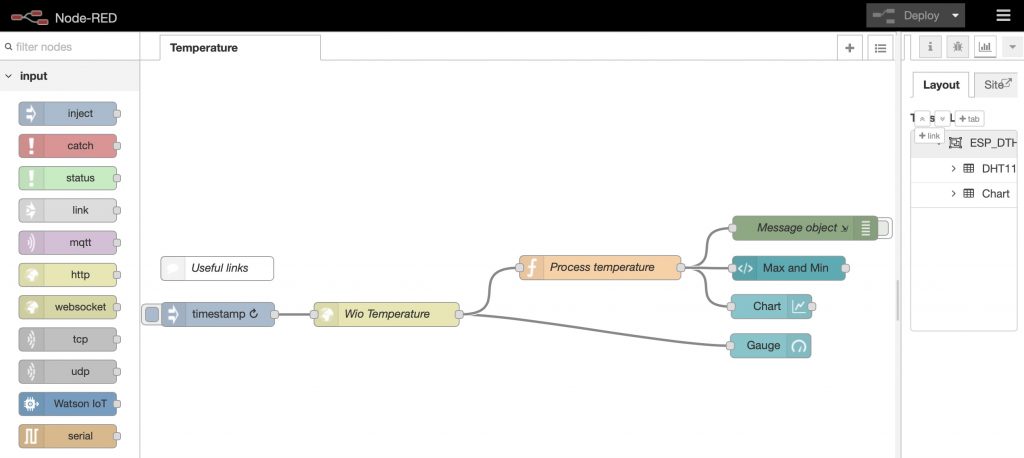
The general Node-RED interface, 'palette' to the left, properties to the right, and design canvas centrally.

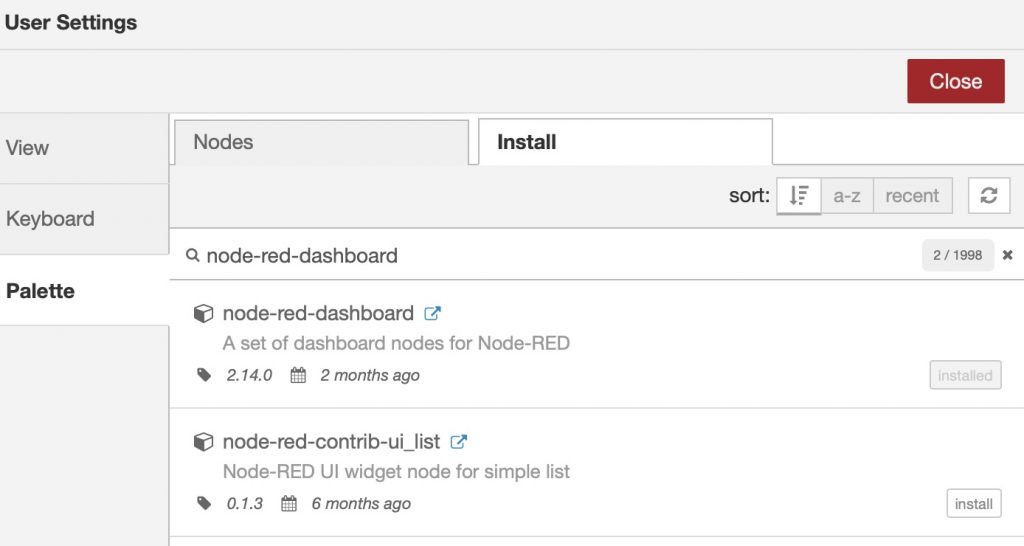
Node-RED allows installation of many modules, one of which permits data dashboards. The data dashboard module is described at https://flows.nodered.org/node/node-red-dashboard. Installation can be via npm, as described at the link above. However, we used the 'Manage Palette' option within the graphical interface to install the new functions.

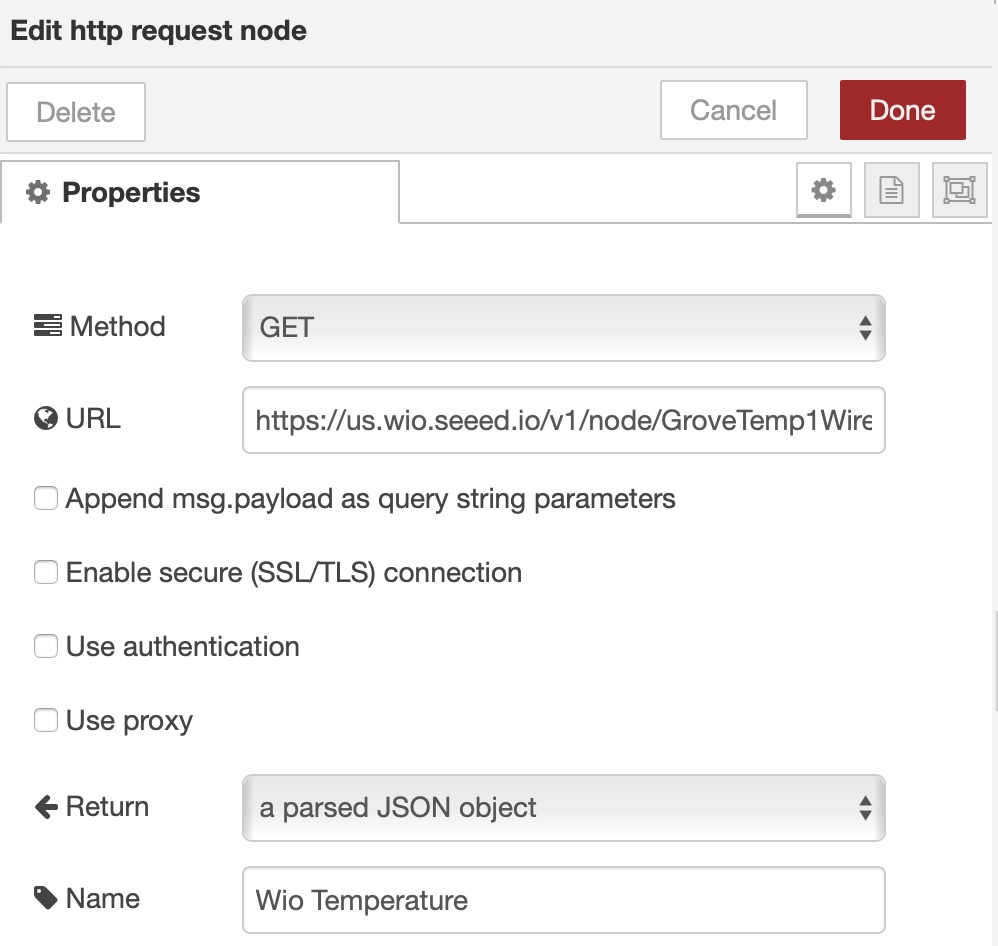
With this installed, the next task was to develop the 'flow', or programme. This starts with a HTTP GET call to the WIO Node as described above. For this the 'http request' node is called, and configured with the URI to the temperature value. After consideration of the various configuration options, we elected to return a 'parsed JSON object'.

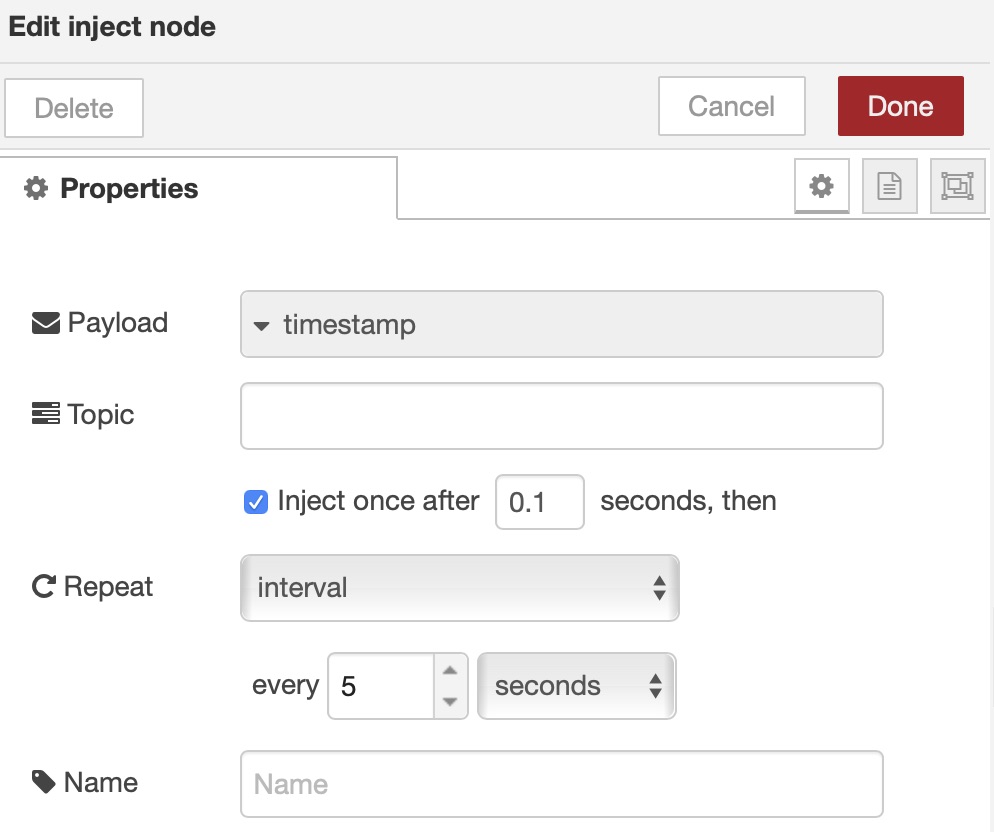
To drive the process whereby the URI is called continuously, the http request call is preceded with an 'inject node', set to run continuously on a timed basis (shown here at 5 seconds, although that could be a longer period).

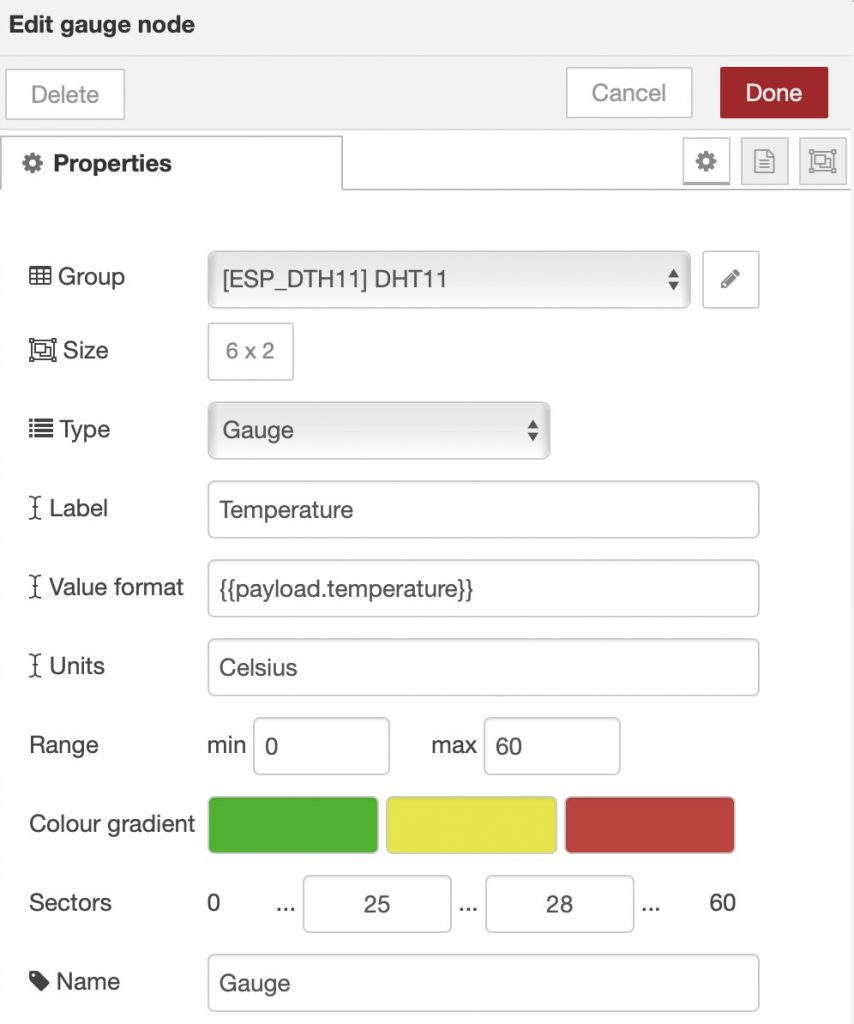
The data that is returned from this process, the 'payload', can now be passed directly to the first element of the dashboard - the gauge. The payload JSON object has a member 'temperature', referenced via the value format {{payload.temperature}}.

The next dashboard elements we wanted are firstly a line graph of temperature over time, and secondly a custom node recording the 'minimum' and 'maximum' temperatures over time. These nodes will need data prepared in a particular way. The graph, or chart, needs data in the form described at https://github.com/node-red/node-red-dashboard/blob/master/Charts.md.

{topic:"temperature", payload:22}

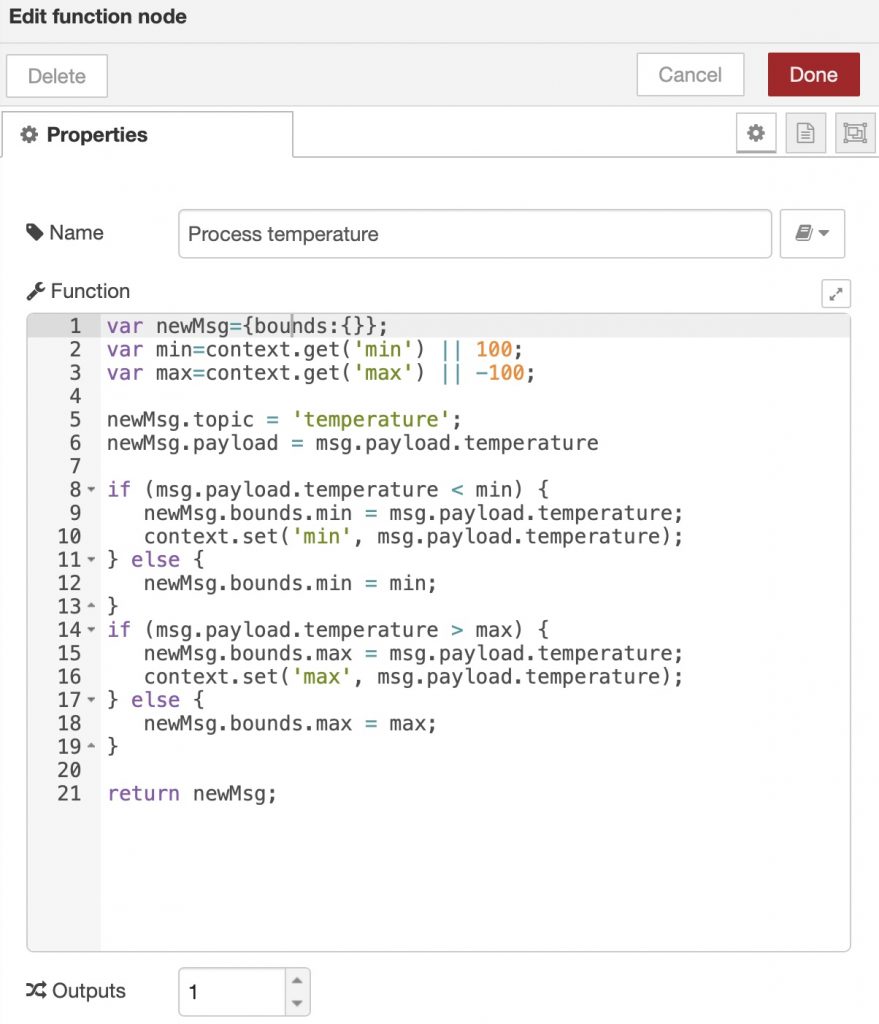
In addition, further JSON elements for minimum and maximum values will be required. In order to construct a revised message payload, a custom script is required. Explanations are in the code below:

// Create a new empty object 'newMsg' to return at the end
// then fill it with another empty object 'bounds'
var newMsg={bounds:{}}; // create

// Create two local variables min and max initialised from the persistent
// context variables of the same names where these values exist, or else
// seed with values we know are off the scale
var min=context.get('min') || 100;
var max=context.get('max') || -100;

// Set an element 'topic' and give the value the string 'temperature'
newMsg.topic = 'temperature';
// Set the payload element to the incoming message payload temperature
newMsg.payload = msg.payload.temperature

// update the min and max, comparing the incoming values to the context
if (msg.payload.temperature < min) {
   newMsg.bounds.min = msg.payload.temperature;
   context.set('min', msg.payload.temperature);
} else {
   newMsg.bounds.min = min;
}
if (msg.payload.temperature > max) {
   newMsg.bounds.max = msg.payload.temperature;
   context.set('max', msg.payload.temperature);
} else {
   newMsg.bounds.max = max;
}

// and finally return the new object 'newMsg'
return newMsg;

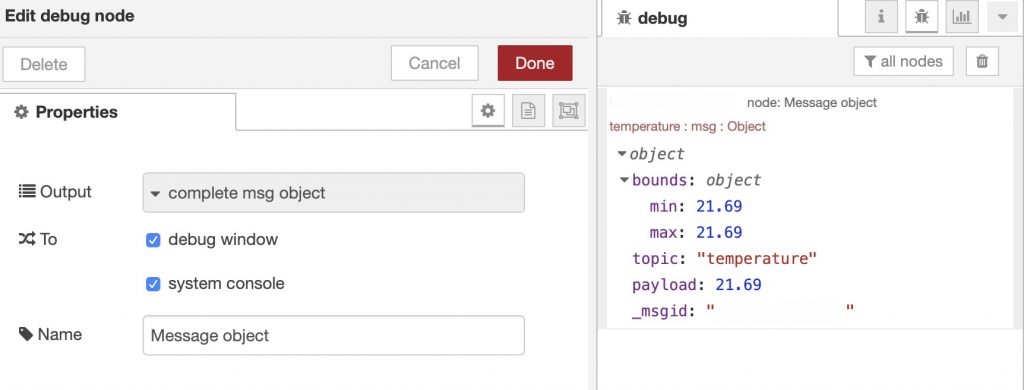
What is always a good idea when processing data is to have a debug that shows the whole message object constructed by this process. To do this, a 'debug node' is added and configured - here to show the 'complete msg object'. We can see the min and max are contained in the bounds node, and that the 'topic' and 'payload' elements are correctly configured.

As a result, the two additional dashboard node widgets can be added, first the chart node. The line interpolation is set here to 'bezier' to provide a smoother visualisation. The time interval is set to 15 minutes.

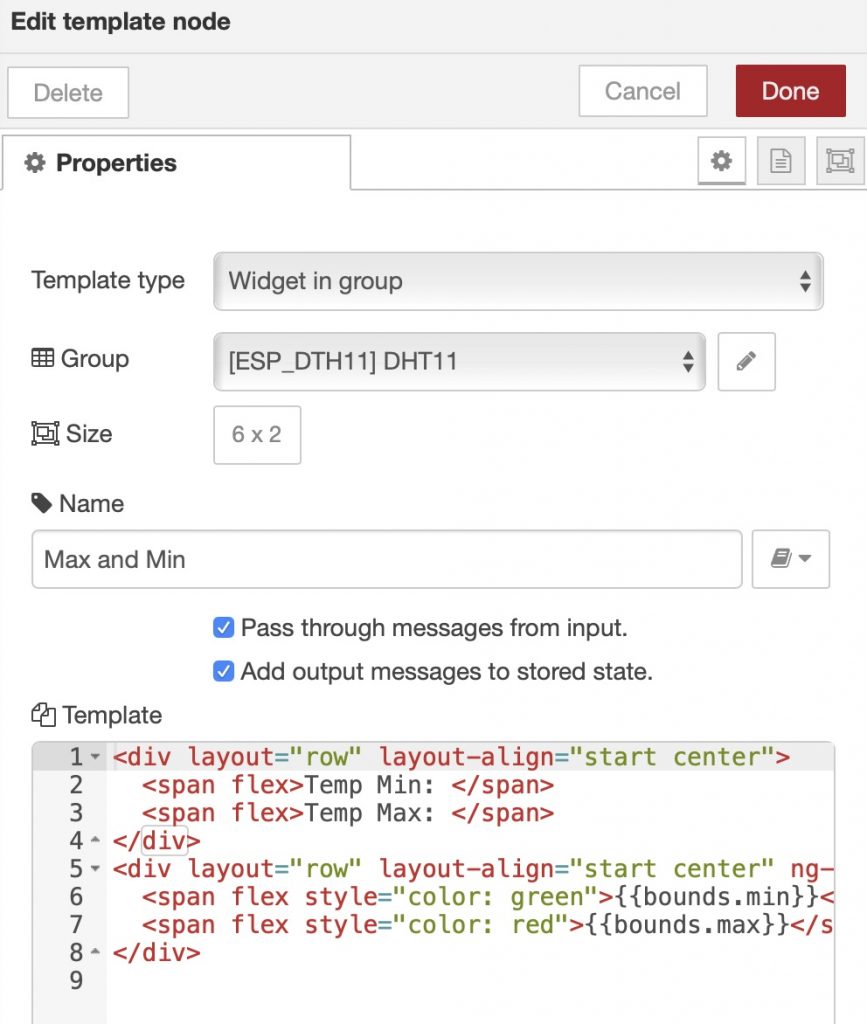
Next we wanted to add a new custom node widget to show a running maximum and minimum value. To do this, we added a 'Template node' and configured it thus:

Temp Min: Temp Max:
{{bounds.min}} {{bounds.max}}

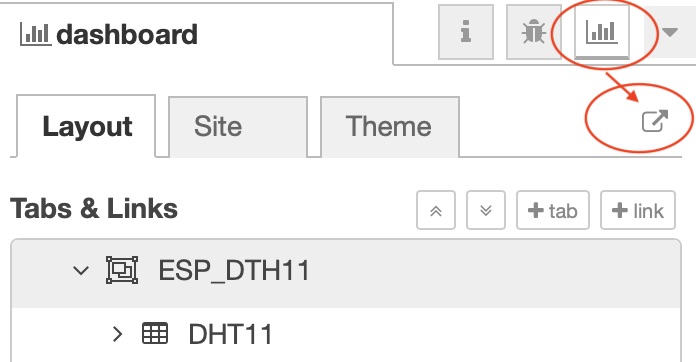
Once these elements are all in place, the 'flow' programme can be deployed. This commences the running of the code, and then the dashboard can be accessed. The easiest means to do this is to follow the link in the properties section as shown:

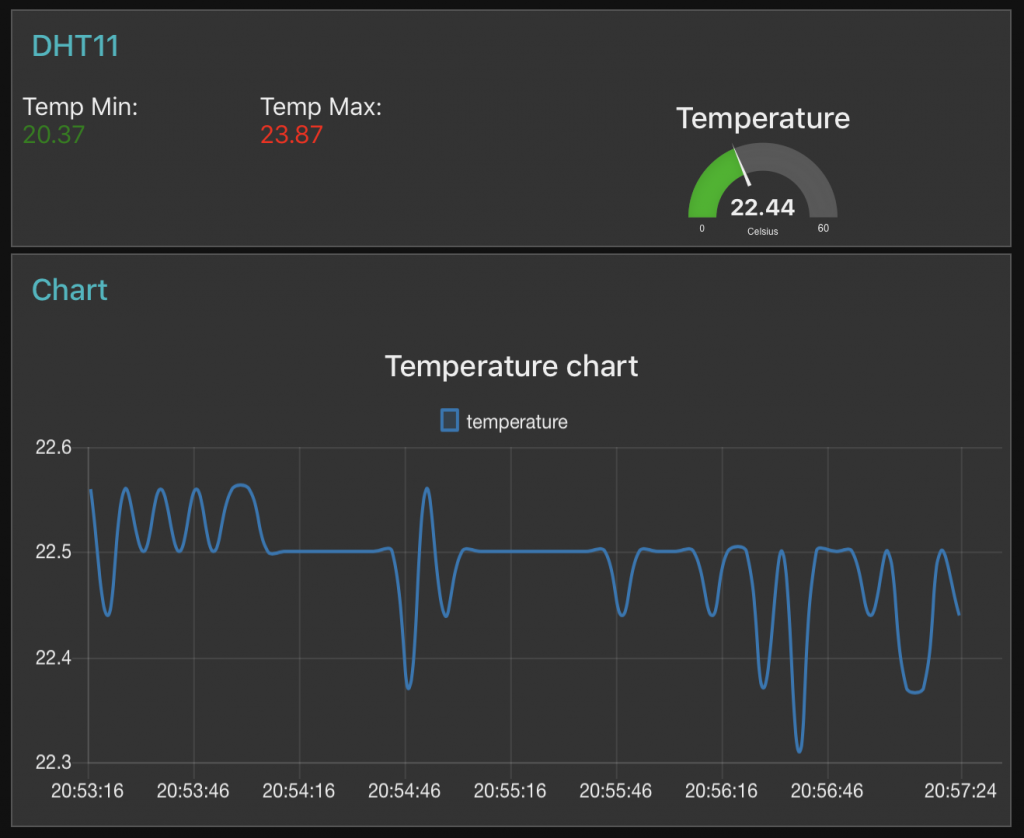
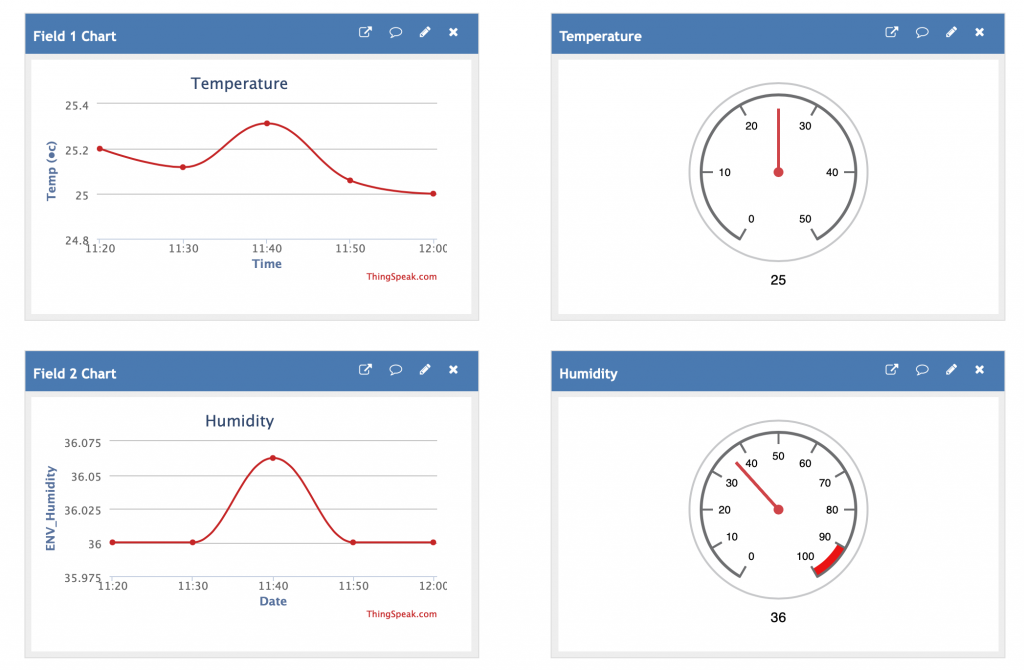
The result is the display of the dashboard. To get this to display as required, one can change the visual style (e.g. to 'dark'), and the dimensions of the canvas. Node dashboard widgets are always rendered to the top left according to the layout properties.

Epilogue

In this blog, we have shown how the Node-RED environment can be used to streamline Node-JS code, with customised elements, and inclusion of libraries of functionality (dashboard). Node-RED is a powerful yet easy to configure environment that is cable of a whole range of functionality though its graphical 'flows'. There are many example flows available on websites that can be downloaded and tested. Flows are designed to be easily imported and exported. Below is the export for the flow described above - to load it, select 'Import' and 'Clipboard' from the main menu options and paste in the following.

[{"id":"d988539b.52bdc8","type":"tab","label":"Temperature","disabled":false,"info":""},{"id":"35963a2e.6aa056","type":"tab","label":"Temperature","disabled":false,"info":""},{"id":"166841a0.b19cce","type":"mqtt-broker","z":"","broker":"192.168.0.6","port":"1883","clientid":"Teste","usetls":false,"compatmode":true,"keepalive":"60","cleansession":true,"birthTopic":"","birthQos":"0","birthPayload":"","willTopic":"","willQos":"0","willPayload":""},{"id":"a76a54d5.4c5998","type":"ui_tab","z":"d988539b.52bdc8","name":"ESP_DTH11","icon":"dashboard","order":3,"disabled":false,"hidden":false},{"id":"519167a8.570e5","type":"ui_group","z":"d988539b.52bdc8","name":"DHT11","tab":"a76a54d5.4c5998","order":1,"disp":true,"width":"12","collapse":false},{"id":"1785bc54.de4d24","type":"ui_base","theme":{"name":"theme-dark","lightTheme":{"default":"#0094CE","baseColor":"#0094CE","baseFont":"-apple-system,BlinkMacSystemFont,Segoe UI,Roboto,Oxygen-Sans,Ubuntu,Cantarell,Helvetica Neue,sans-serif","edited":true,"reset":false},"darkTheme":{"default":"#097479","baseColor":"#097479","baseFont":"-apple-system,BlinkMacSystemFont,Segoe UI,Roboto,Oxygen-Sans,Ubuntu,Cantarell,Helvetica Neue,sans-serif","edited":true,"reset":false},"customTheme":{"name":"Untitled Theme 1","default":"#4B7930","baseColor":"#4B7930","baseFont":"-apple-system,BlinkMacSystemFont,Segoe UI,Roboto,Oxygen-Sans,Ubuntu,Cantarell,Helvetica Neue,sans-serif"},"themeState":{"base-color":{"default":"#097479","value":"#097479","edited":false},"page-titlebar-backgroundColor":{"value":"#097479","edited":false},"page-backgroundColor":{"value":"#111111","edited":false},"page-sidebar-backgroundColor":{"value":"#000000","edited":false},"group-textColor":{"value":"#0eb8c0","edited":false},"group-borderColor":{"value":"#555555","edited":false},"group-backgroundColor":{"value":"#333333","edited":false},"widget-textColor":{"value":"#eeeeee","edited":false},"widget-backgroundColor":{"value":"#097479","edited":false},"widget-borderColor":{"value":"#333333","edited":false},"base-font":{"value":"-apple-system,BlinkMacSystemFont,Segoe UI,Roboto,Oxygen-Sans,Ubuntu,Cantarell,Helvetica Neue,sans-serif"}},"angularTheme":{"primary":"indigo","accents":"blue","warn":"red","background":"grey"}},"site":{"name":"Node-RED Dashboard","hideToolbar":"false","allowSwipe":"false","lockMenu":"false","allowTempTheme":"true","dateFormat":"DD/MM/YYYY","sizes":{"sx":48,"sy":48,"gx":6,"gy":6,"cx":6,"cy":6,"px":0,"py":0}}},{"id":"749056a0.0a1d28","type":"ui_group","z":"","name":"Chart","tab":null,"order":2,"disp":true,"width":"12","collapse":false},{"id":"684a7caa.4db0f4","type":"ui_group","z":"","name":"Chart","tab":"a76a54d5.4c5998","order":2,"disp":true,"width":"12","collapse":false},{"id":"84ea1128.ec6fd","type":"ui_tab","z":"35963a2e.6aa056","name":"ESP_DTH11","icon":"dashboard","order":3,"disabled":false,"hidden":false},{"id":"c86b0ed1.65efc8","type":"ui_group","z":"35963a2e.6aa056","name":"DHT11","tab":"84ea1128.ec6fd","order":1,"disp":true,"width":"12","collapse":false},{"id":"a7d331dd.9d8078","type":"debug","z":"d988539b.52bdc8","name":"Message object","active":true,"tosidebar":true,"console":true,"tostatus":false,"complete":"true","targetType":"full","x":1129.75,"y":286.9166564941406,"wires":[]},{"id":"aa810265.1f789","type":"ui_gauge","z":"d988539b.52bdc8","name":"Gauge","group":"519167a8.570e5","order":0,"width":"6","height":"2","gtype":"gage","title":"Temperature","label":"Celsius","format":"{{payload.temperature}}","min":0,"max":"60","colors":["#00b500","#e6e600","#ca3838"],"seg1":"25","seg2":"28","x":1086.833251953125,"y":432.8055419921875,"wires":[]},{"id":"aa922201.f96eb8","type":"inject","z":"d988539b.52bdc8","name":"","topic":"","payload":"","payloadType":"date","repeat":"","crontab":"","once":true,"onceDelay":0.1,"x":401.5,"y":394,"wires":[["cbeca854.f6174"]]},{"id":"cbeca854.f6174","type":"http request","z":"d988539b.52bdc8","name":"Wio Temperature","method":"GET","ret":"obj","paytoqs":false,"url":"https://us.wio.seeed.io/v1/node/GroveTemp1WireD1/temp?access_token=7c6297dfa2e48793c58a53269bc23ef0","tls":"","proxy":"","authType":"basic","x":610.5,"y":394,"wires":[["aa810265.1f789","cd69dcd.1c5d3a"]]},{"id":"af52c259.fecbd8","type":"ui_chart","z":"d988539b.52bdc8","name":"Chart","group":"684a7caa.4db0f4","order":2,"width":"12","height":"7","label":"Temperature chart","chartType":"line","legend":"true","xformat":"HH:mm:ss","interpolate":"bezier","nodata":"","dot":false,"ymin":"","ymax":"","removeOlder":"15 ","removeOlderPoints":"50","removeOlderUnit":"60","cutout":0,"useOneColor":false,"colors":["#1f77b4","#aec7e8","#ff7f0e","#2ca02c","#98df8a","#d62728","#ff9896","#9467bd","#c5b0d5"],"useOldStyle":false,"outputs":1,"x":1087.8333740234375,"y":384.22222900390625,"wires":[[]]},{"id":"cd69dcd.1c5d3a","type":"function","z":"d988539b.52bdc8","name":"Process temperature","func":"var newMsg={bounds:{}};\nvar min=context.get('min') || 100;\nvar max=context.get('max') || -100;\n\n// http://www.steves-internet-guide.com/node-red-variables/\nnewMsg.topic = 'temperature';\nnewMsg.payload = msg.payload.temperature\n\nif (msg.payload.temperature < min) {\n newMsg.bounds.min = msg.payload.temperature;\n context.set('min', msg.payload.temperature);\n} else {\n newMsg.bounds.min = min;\n}\nif (msg.payload.temperature > max) {\n newMsg.bounds.max = msg.payload.temperature;\n context.set('max', msg.payload.temperature);\n} else {\n newMsg.bounds.max = max;\n}\n\nreturn newMsg;","outputs":1,"noerr":0,"x":875.5,"y":336,"wires":[["af52c259.fecbd8","a7d331dd.9d8078","81bda4f5.6f104"]]},{"id":"259fa218.53bdbe","type":"comment","z":"d988539b.52bdc8","name":"Useful links","info":"see:\nhttps://github.com/node-red/node-red-dashboard/blob/master/Charts.md\nhttp://noderedguide.com/tutorial-node-red-dashboards-multiple-lines-on-a-chart/#more-1612\nhttp://www.steves-internet-guide.com/node-red-functions/\nhttp://www.steves-internet-guide.com/node-red-dashboard/","x":400.5,"y":337,"wires":[]},{"id":"81bda4f5.6f104","type":"ui_template","z":"d988539b.52bdc8","group":"519167a8.570e5","name":"Max and Min","order":2,"width":"6","height":"2","format":"

\n Temp Min: \n Temp Max: \n

\n

\n {{bounds.min}}\n {{bounds.max}}\n

\n","storeOutMessages":true,"fwdInMessages":true,"templateScope":"local","x":1109.4444122314453,"y":336.6666717529297,"wires":[[]]},{"id":"f5bb5785.45e55","type":"debug","z":"35963a2e.6aa056","name":"Message object","active":true,"tosidebar":true,"console":true,"tostatus":false,"complete":"true","targetType":"full","x":1129.75,"y":286.9166564941406,"wires":[]},{"id":"27187c33.85c07c","type":"ui_gauge","z":"35963a2e.6aa056","name":"Gauge","group":"c86b0ed1.65efc8","order":0,"width":"6","height":"2","gtype":"gage","title":"Temperature","label":"Celsius","format":"{{payload.temperature}}","min":0,"max":"60","colors":["#00b500","#e6e600","#ca3838"],"seg1":"25","seg2":"28","x":1086.833251953125,"y":432.8055419921875,"wires":[]},{"id":"cd94fffc.6f0da8","type":"inject","z":"35963a2e.6aa056","name":"","topic":"","payload":"","payloadType":"date","repeat":"","crontab":"","once":true,"onceDelay":0.1,"x":401.5,"y":394,"wires":[["ab8d1686.0264d"]]},{"id":"ab8d1686.0264d","type":"http request","z":"35963a2e.6aa056","name":"Wio Temperature","method":"GET","ret":"obj","paytoqs":false,"url":"https://us.wio.seeed.io/v1/node/GroveTemp1WireD1/temp?access_token=<>","tls":"","proxy":"","authType":"basic","x":610.5,"y":394,"wires":[["27187c33.85c07c","ce9f0009.faab98"]]},{"id":"dbe1013a.863be8","type":"ui_chart","z":"35963a2e.6aa056","name":"Chart","group":"684a7caa.4db0f4","order":2,"width":"12","height":"7","label":"Temperature chart","chartType":"line","legend":"true","xformat":"HH:mm:ss","interpolate":"bezier","nodata":"","dot":false,"ymin":"","ymax":"","removeOlder":"15 ","removeOlderPoints":"50","removeOlderUnit":"60","cutout":0,"useOneColor":false,"colors":["#1f77b4","#aec7e8","#ff7f0e","#2ca02c","#98df8a","#d62728","#ff9896","#9467bd","#c5b0d5"],"useOldStyle":false,"outputs":1,"x":1087.8333740234375,"y":384.22222900390625,"wires":[[]]},{"id":"ce9f0009.faab98","type":"function","z":"35963a2e.6aa056","name":"Process temperature","func":"var newMsg={bounds:{}};\nvar min=context.get('min') || 100;\nvar max=context.get('max') || -100;\n\nnewMsg.topic = 'temperature';\nnewMsg.payload = msg.payload.temperature\n\nif (msg.payload.temperature < min) {\n newMsg.bounds.min = msg.payload.temperature;\n context.set('min', msg.payload.temperature);\n} else {\n newMsg.bounds.min = min;\n}\nif (msg.payload.temperature > max) {\n newMsg.bounds.max = msg.payload.temperature;\n context.set('max', msg.payload.temperature);\n} else {\n newMsg.bounds.max = max;\n}\n\nreturn newMsg;","outputs":1,"noerr":0,"x":875.5,"y":336,"wires":[["dbe1013a.863be8","f5bb5785.45e55","b809b11b.7f47c8"]]},{"id":"b809b11b.7f47c8","type":"ui_template","z":"35963a2e.6aa056","group":"c86b0ed1.65efc8","name":"Max and Min","order":2,"width":"6","height":"2","format":"

\n Temp Min: \n Temp Max: \n

\n

\n {{bounds.min}}\n {{bounds.max}}\n

\n","storeOutMessages":true,"fwdInMessages":true,"templateScope":"local","x":1109.4444122314453,"y":336.6666717529297,"wires":[[]]}]


]]>