Raspberry Pi Exhibition Demonstrator
In this post, we describe the development of a demonstrator for an exhibition using a Raspberry Pi. Here at Cranfield University we are fortunate to be attending the American Association for the Advancement of Science (AAAS) annual conference and exhibition in Seattle, USA in February 2020, and are making preparations. The task is to develop for this a stand-alone technical demonstrator, showcasing British science and technology – and in doing this what could be better than the use of a Raspberry Pi. We will develop an environmental sensing demonstrator.
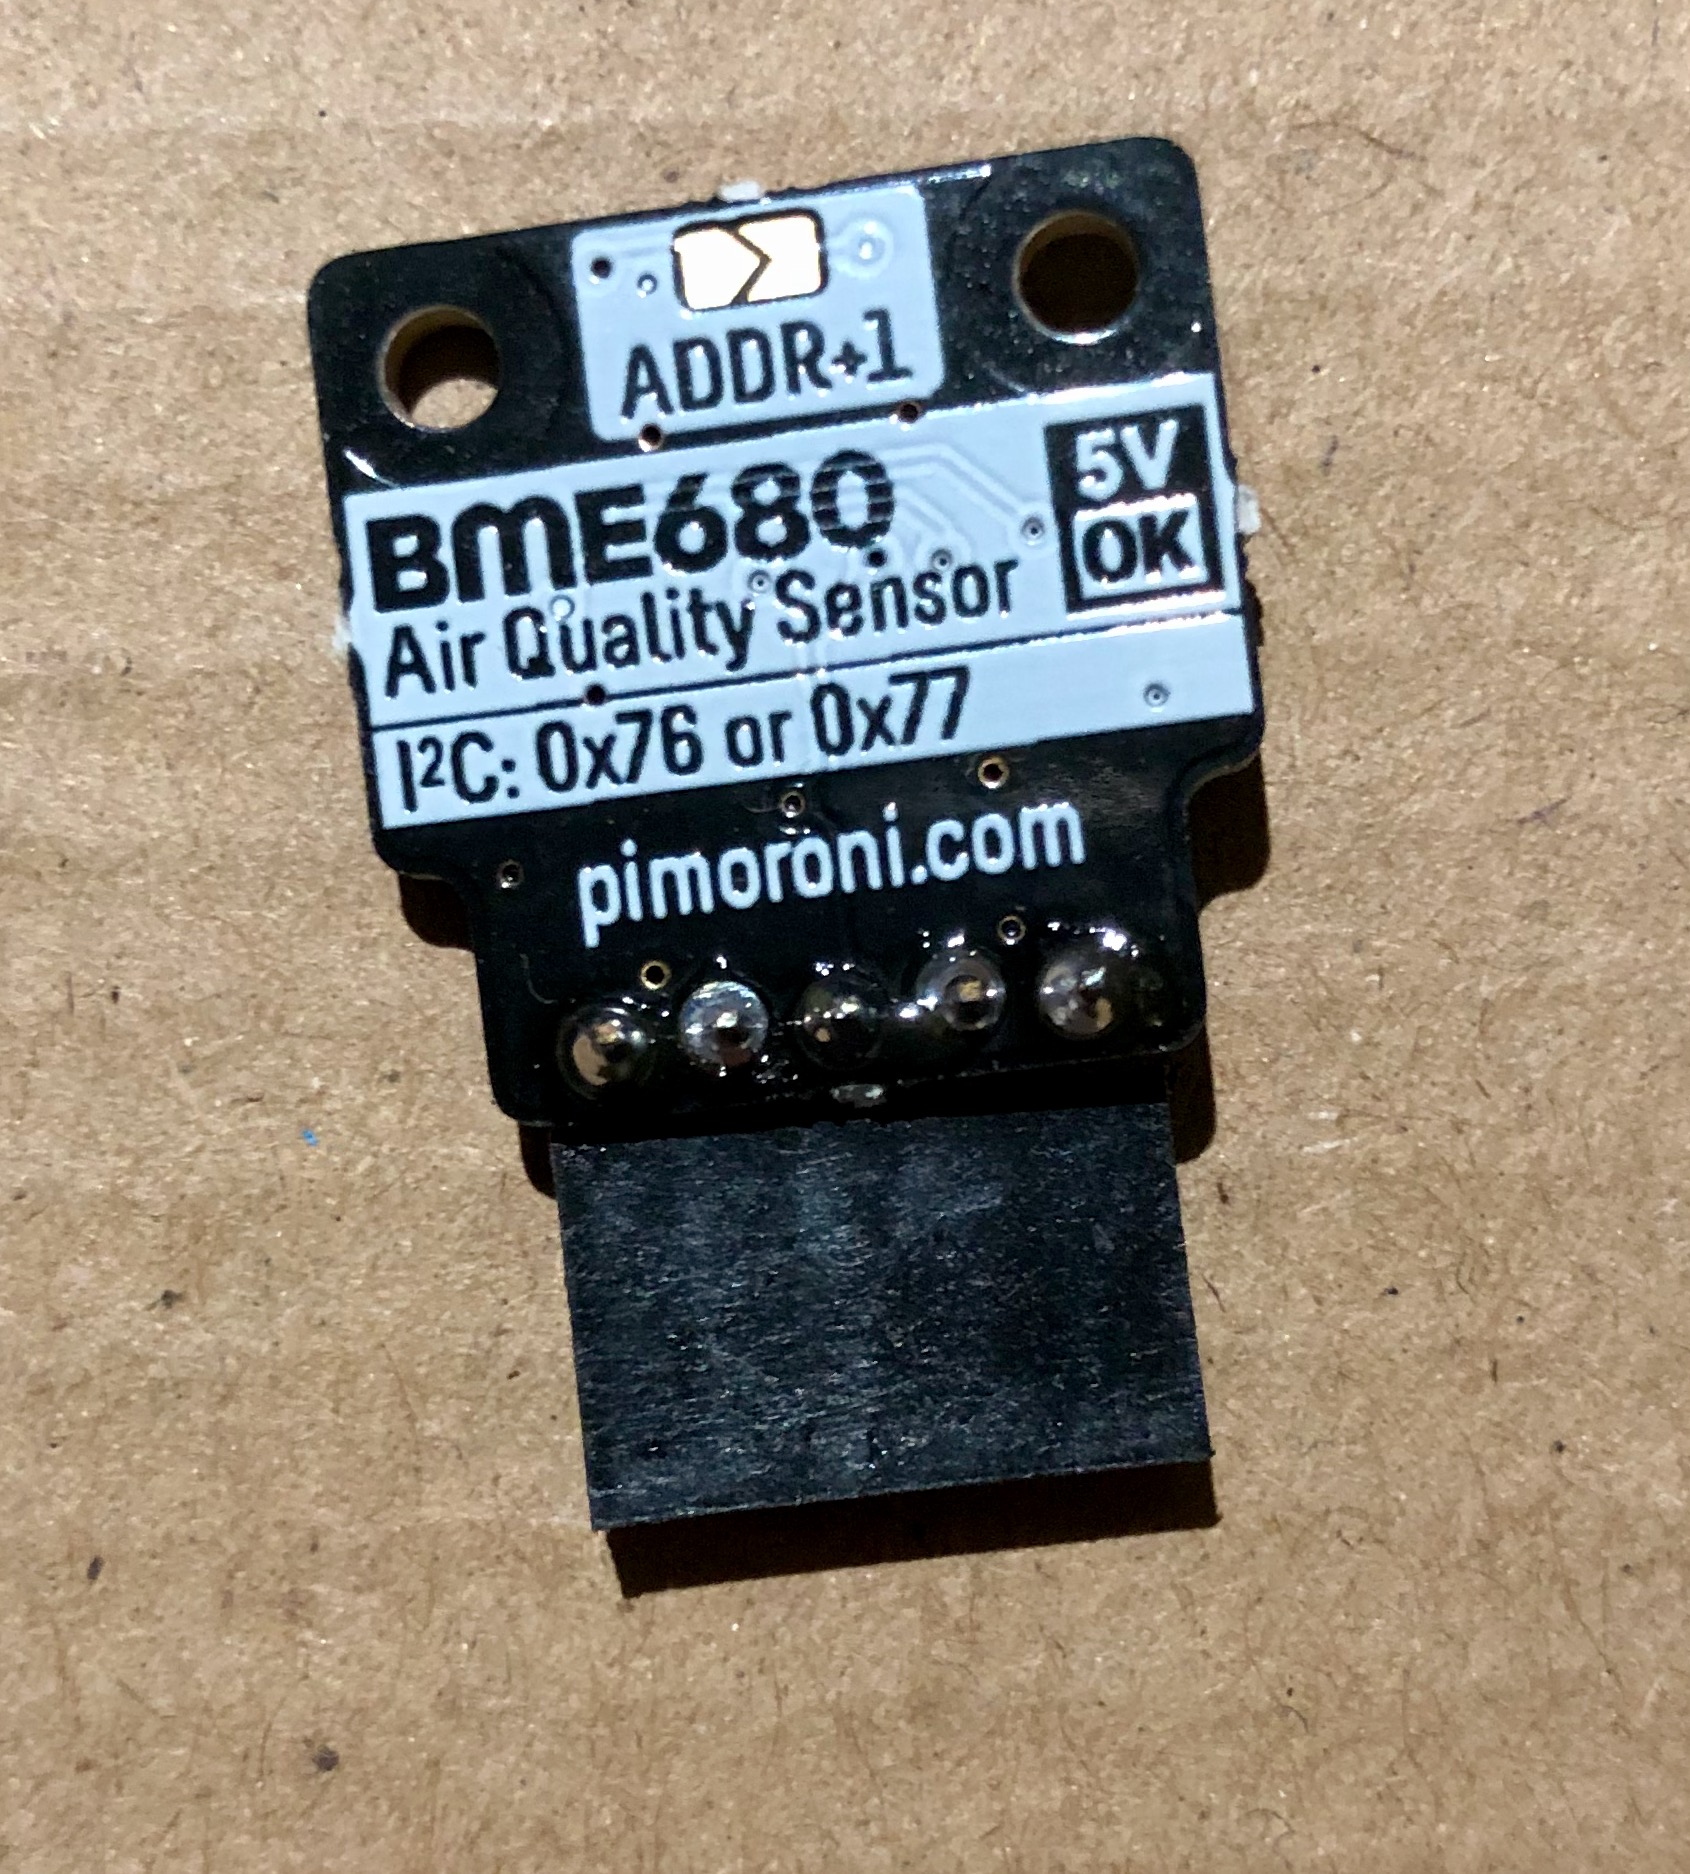
In previous blogs, we have explored the use of the fantastic Bosch BME680 sensor from PiMoroni and now we will use it with a Raspberry Pi and a built-in data dashboard showing real time environmental data.
Hardware
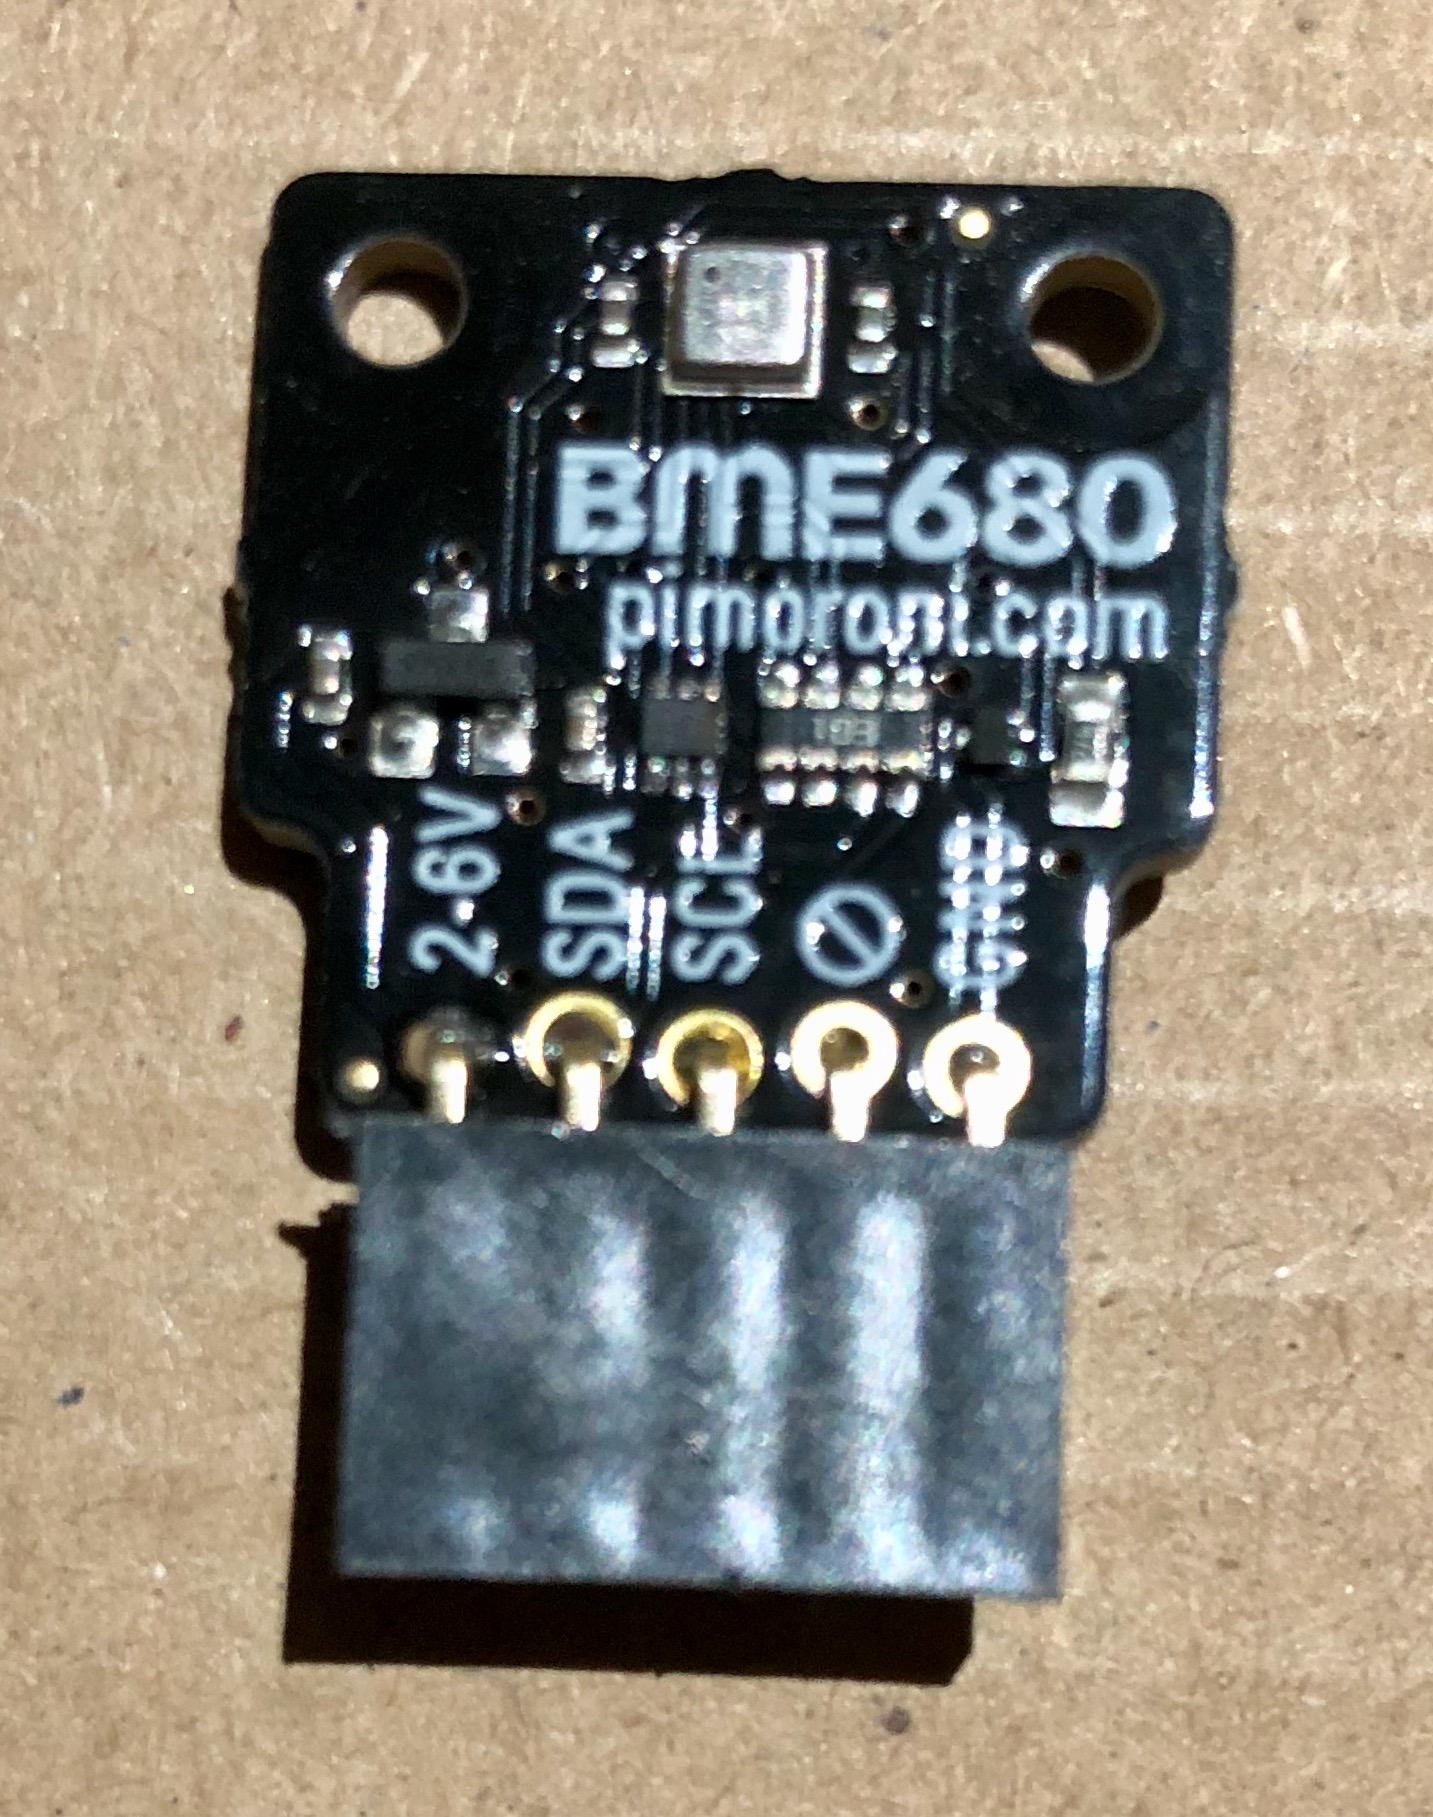
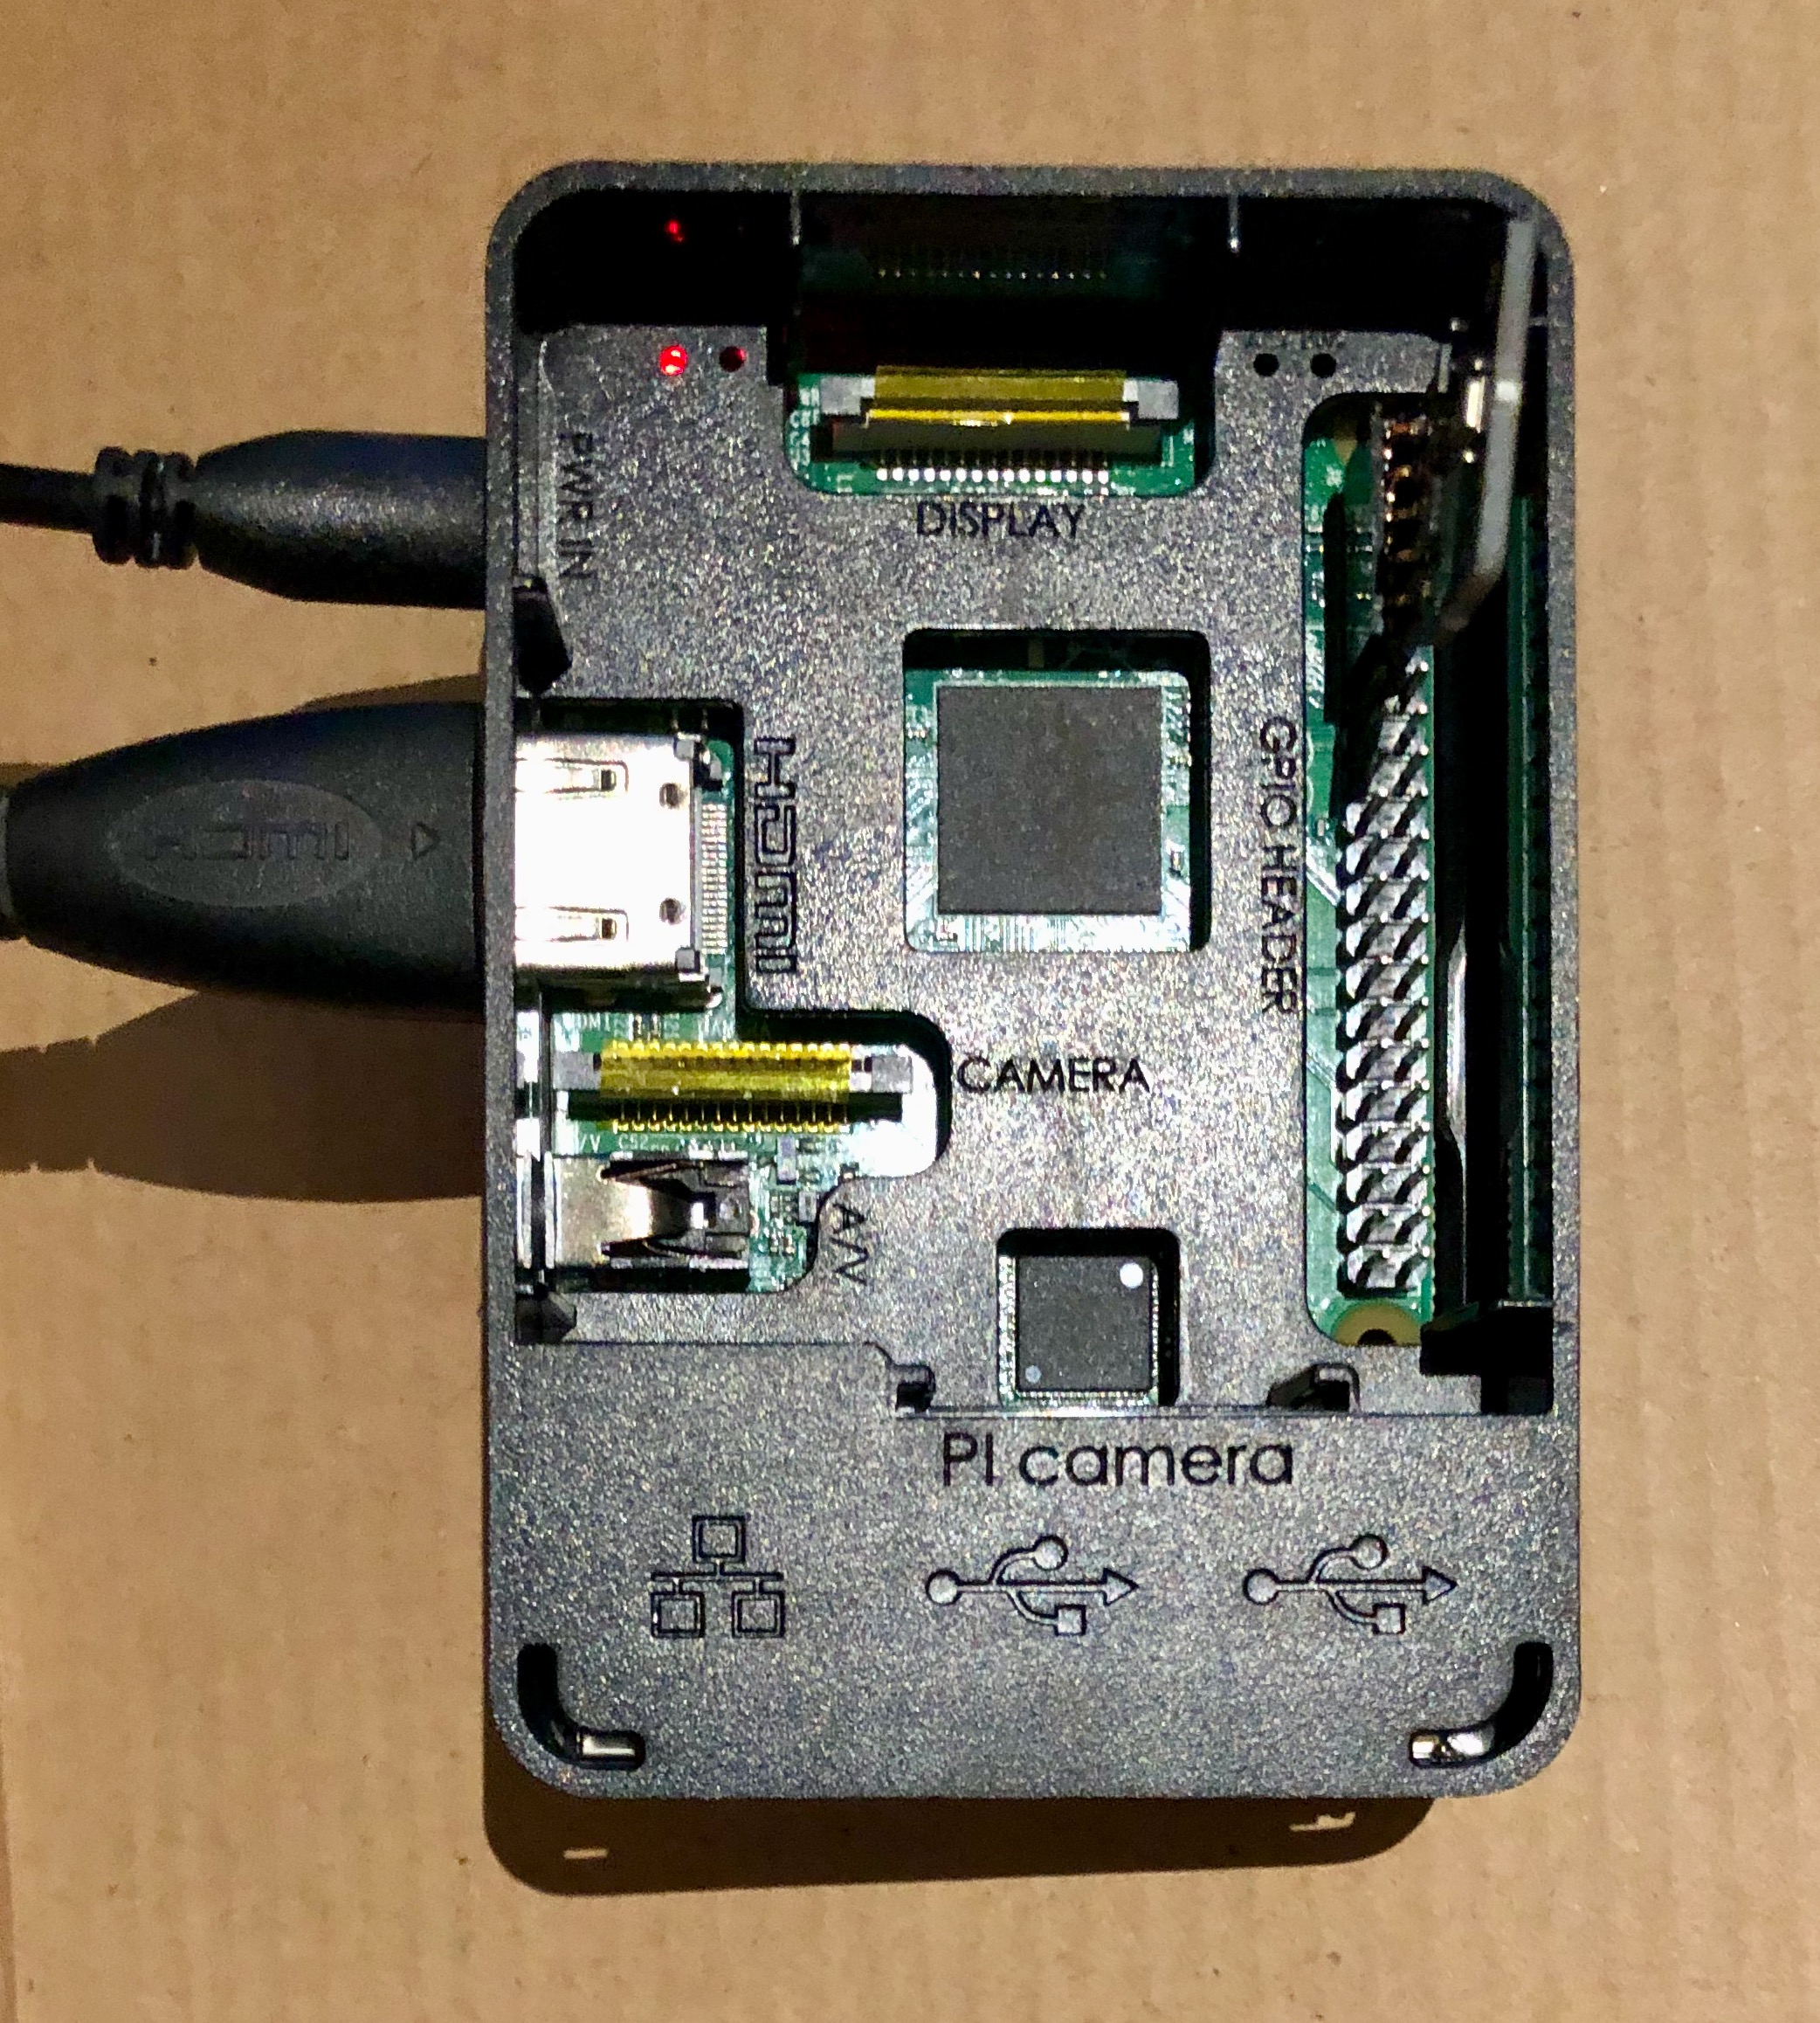
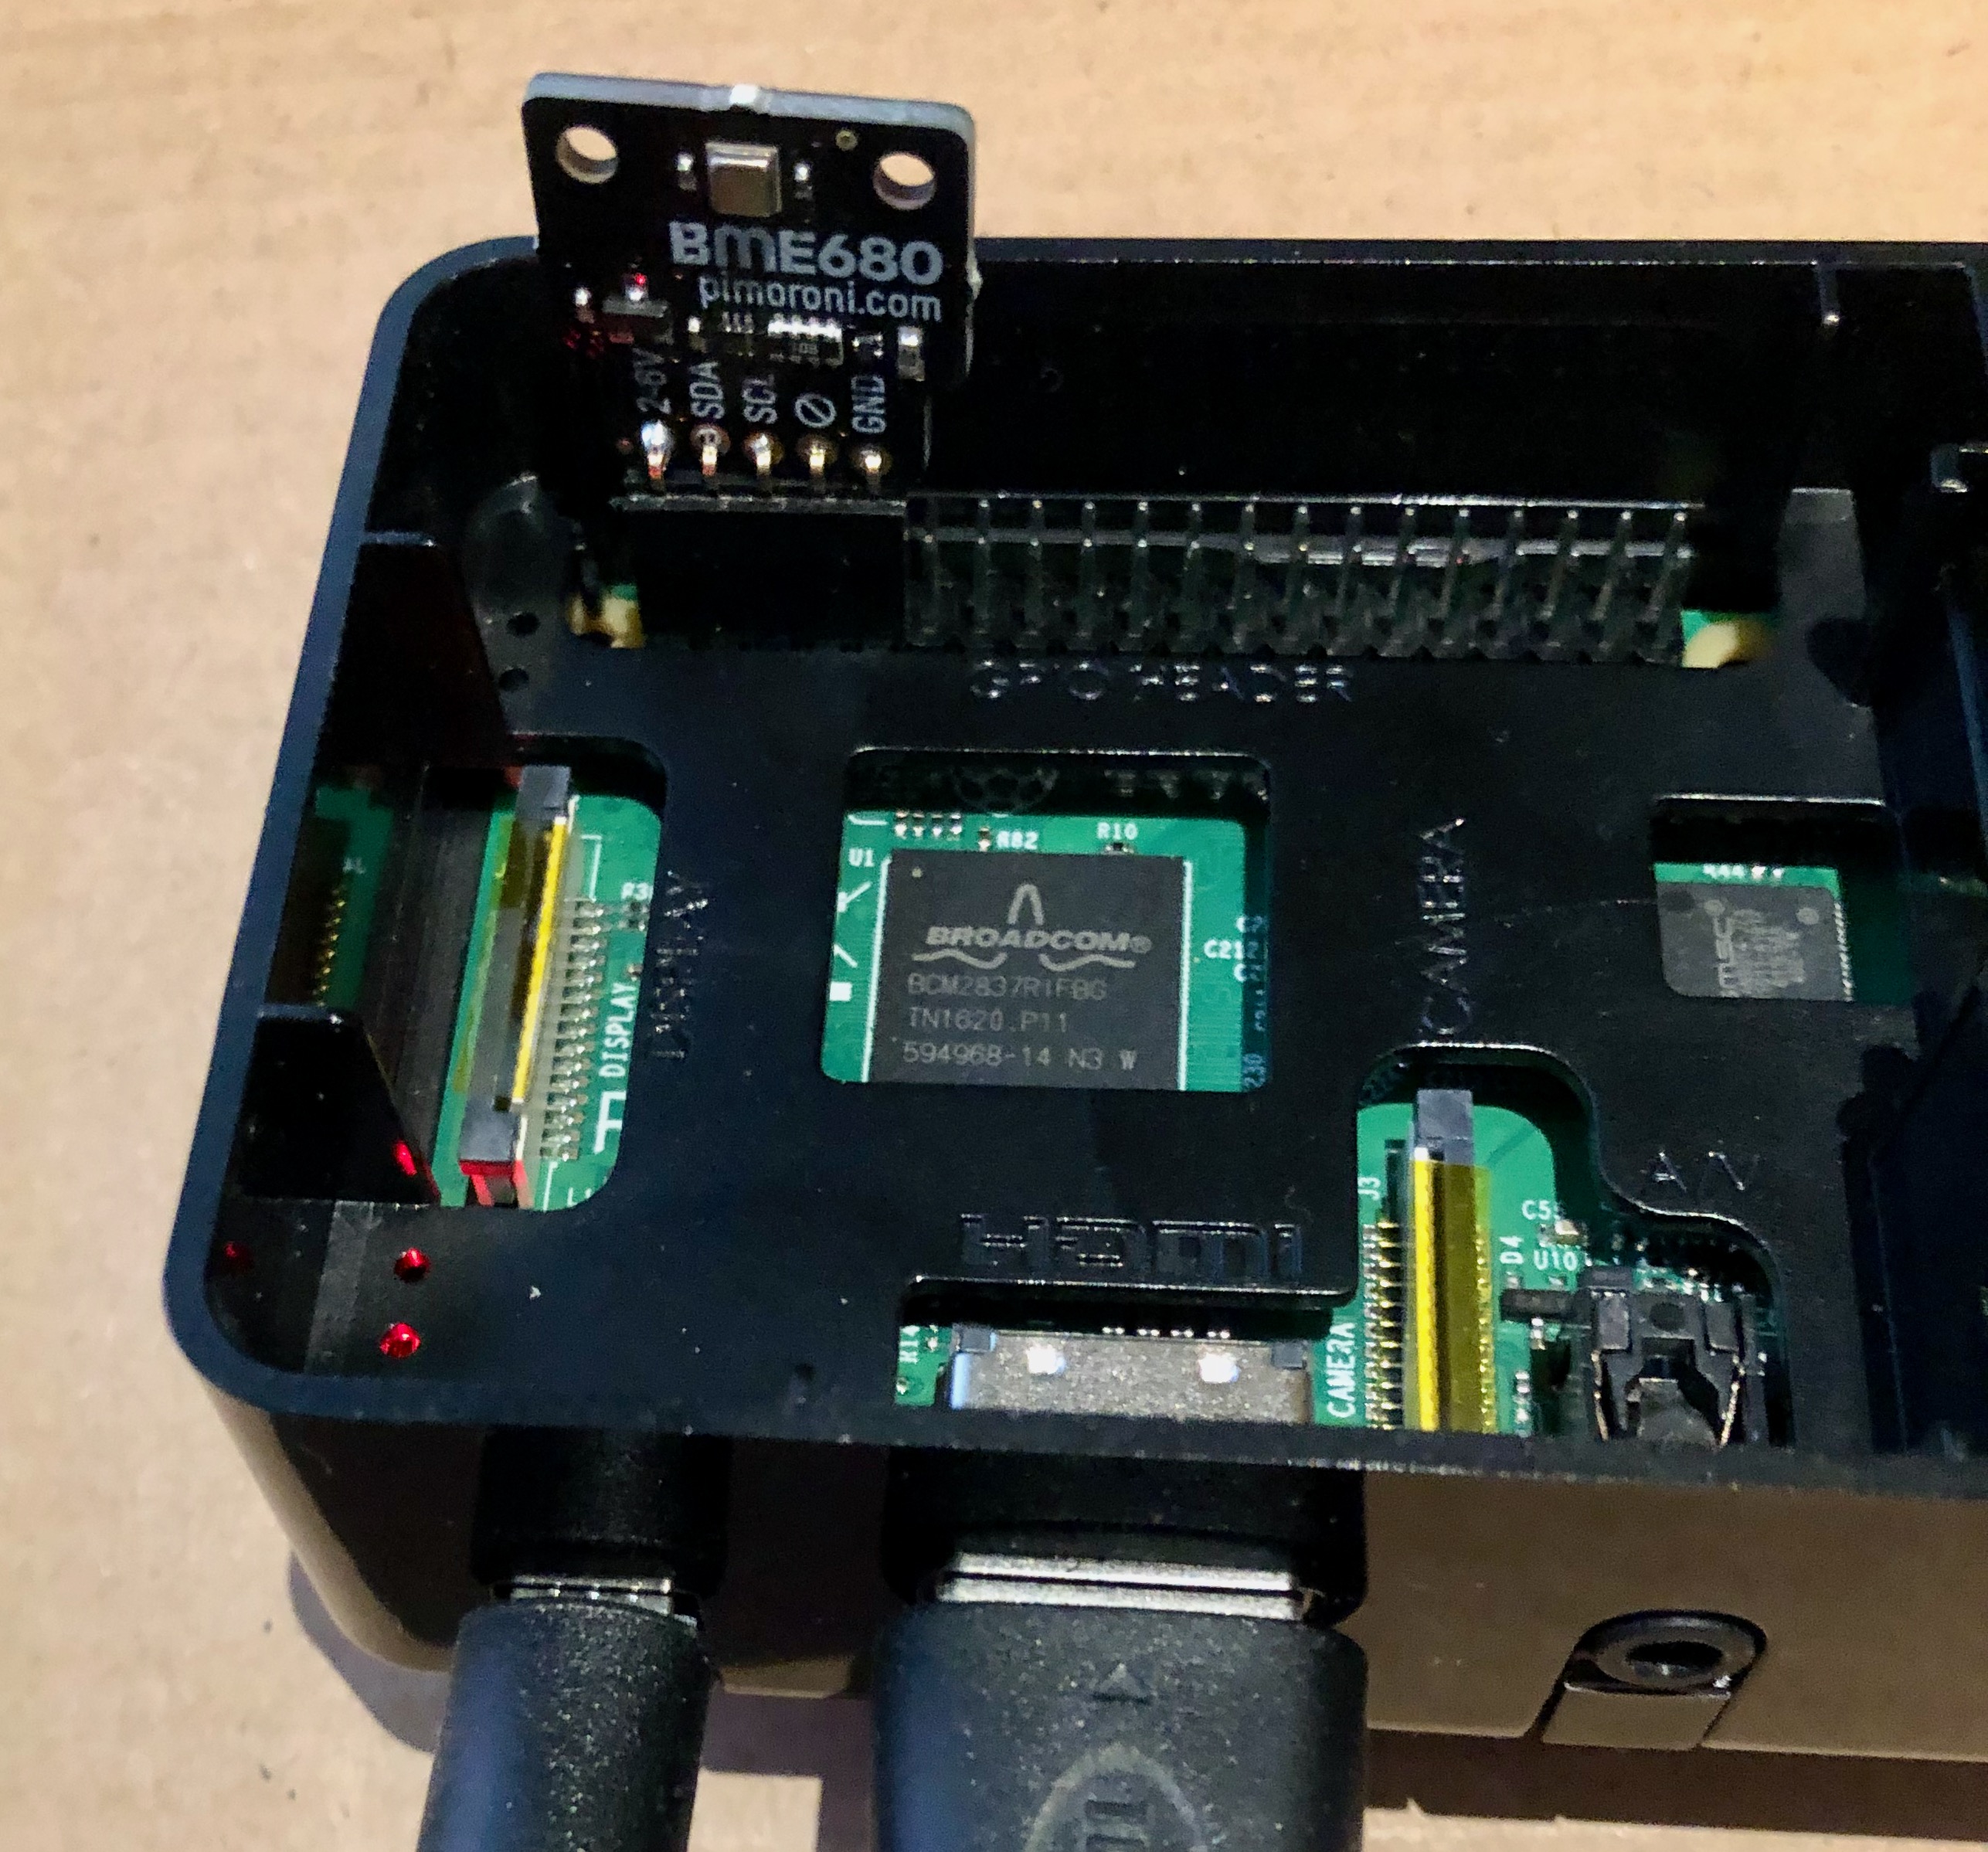
The pin confirmation of the BME680 breakout board from PiMoroni is designed to match the order of the GPIO pins on the Raspberry Pi, meaning that the breakout board can be plugged directly into the PI. The first task was to solder up a BME680 breakout board with header pin sockets to allow it to plug into the Pi.
Once the pin connectors are soldered in, the unit can be simply plugged into the Pi’s GPIO pins, noting the configuration of the pins (https://www.raspberrypi.org/documentation/usage/gpio/).
Software
Previous blogs here have covered how to set the Raspberry Pi up from the start – see http://www.geothread.net/raspberry-pi-headless-setup/.
Now a Python script is required that can read the BME680 sensors and output the data. For this we used the excellent instructions on the PiMoroni webpage (good pirates!) – see https://learn.pimoroni.com/tutorial/sandyj/getting-started-with-bme680-breakout.
We left the I2C address the default one (e.g. didn’t solder the pads on the breakout board). We used raspi-config tool to ensure the I2C was enabled on the Pi. We used the simple installation script to install all the libraries required:
curl https://get.pimoroni.com/i2c | bash
Next we built a Python script to read the data off every 10 seconds. The formatting of the output was changed to a format based on JSON.
import bme680 import time sensor = bme680.BME680() sensor.set_humidity_oversample(bme680.OS_2X) sensor.set_pressure_oversample(bme680.OS_4X) sensor.set_temperature_oversample(bme680.OS_8X) sensor.set_filter(bme680.FILTER_SIZE_3) sensor.set_gas_status(bme680.ENABLE_GAS_MEAS) sensor.set_gas_heater_temperature(320) sensor.set_gas_heater_duration(150) sensor.select_gas_heater_profile(0) while True:
      if sensor.get_sensor_data():
          #output = "{0:.2f} C,{1:.2f} hPa,{2:.2f} %RH".format(sensor.data.temperature, sensor.data.pressure, sensor.data.humidity)
         output = '{{"Temperature_oC":{0:.2f}}},{{"Pressure_HPA":{1:.2f}}},{{"RelativeHumidity_percent":{2:.2f}}}'.format(sensor.data.temperature, sensor.data.pressure, sensor.data.humidity)
          if sensor.data.heat_stable:
             print('{0},{{"Resistance_Ohms":{1}}}'.format(output, sensor.data.gas _resistance))
         else:
              print(output)      time.sleep(10)
We could then run the script to make sure it produced data, which it did thus:
$ python read.py
{"Temperature_oC":29.42},{"Pressure_HPA":1018.88},{"RelativeHumidity_percent":31.68},{"Resistance_Ohms":154806}
{"Temperature_oC":29.35},{"Pressure_HPA":1018.93},{"RelativeHumidity_percent":31.58},{"Resistance_Ohms":174661}
Building a Dashboard
We now need a dashboard to display the data and to do this we wanted to use the open source NodeRED tool. We have used NodeRED in earlier blogs (http://www.geothread.net/node-red-and-the-internet-of-things/) to build interfaces and to gather data, and the installation instructions have been described there. The NodeRED installation installs Node.JS also.
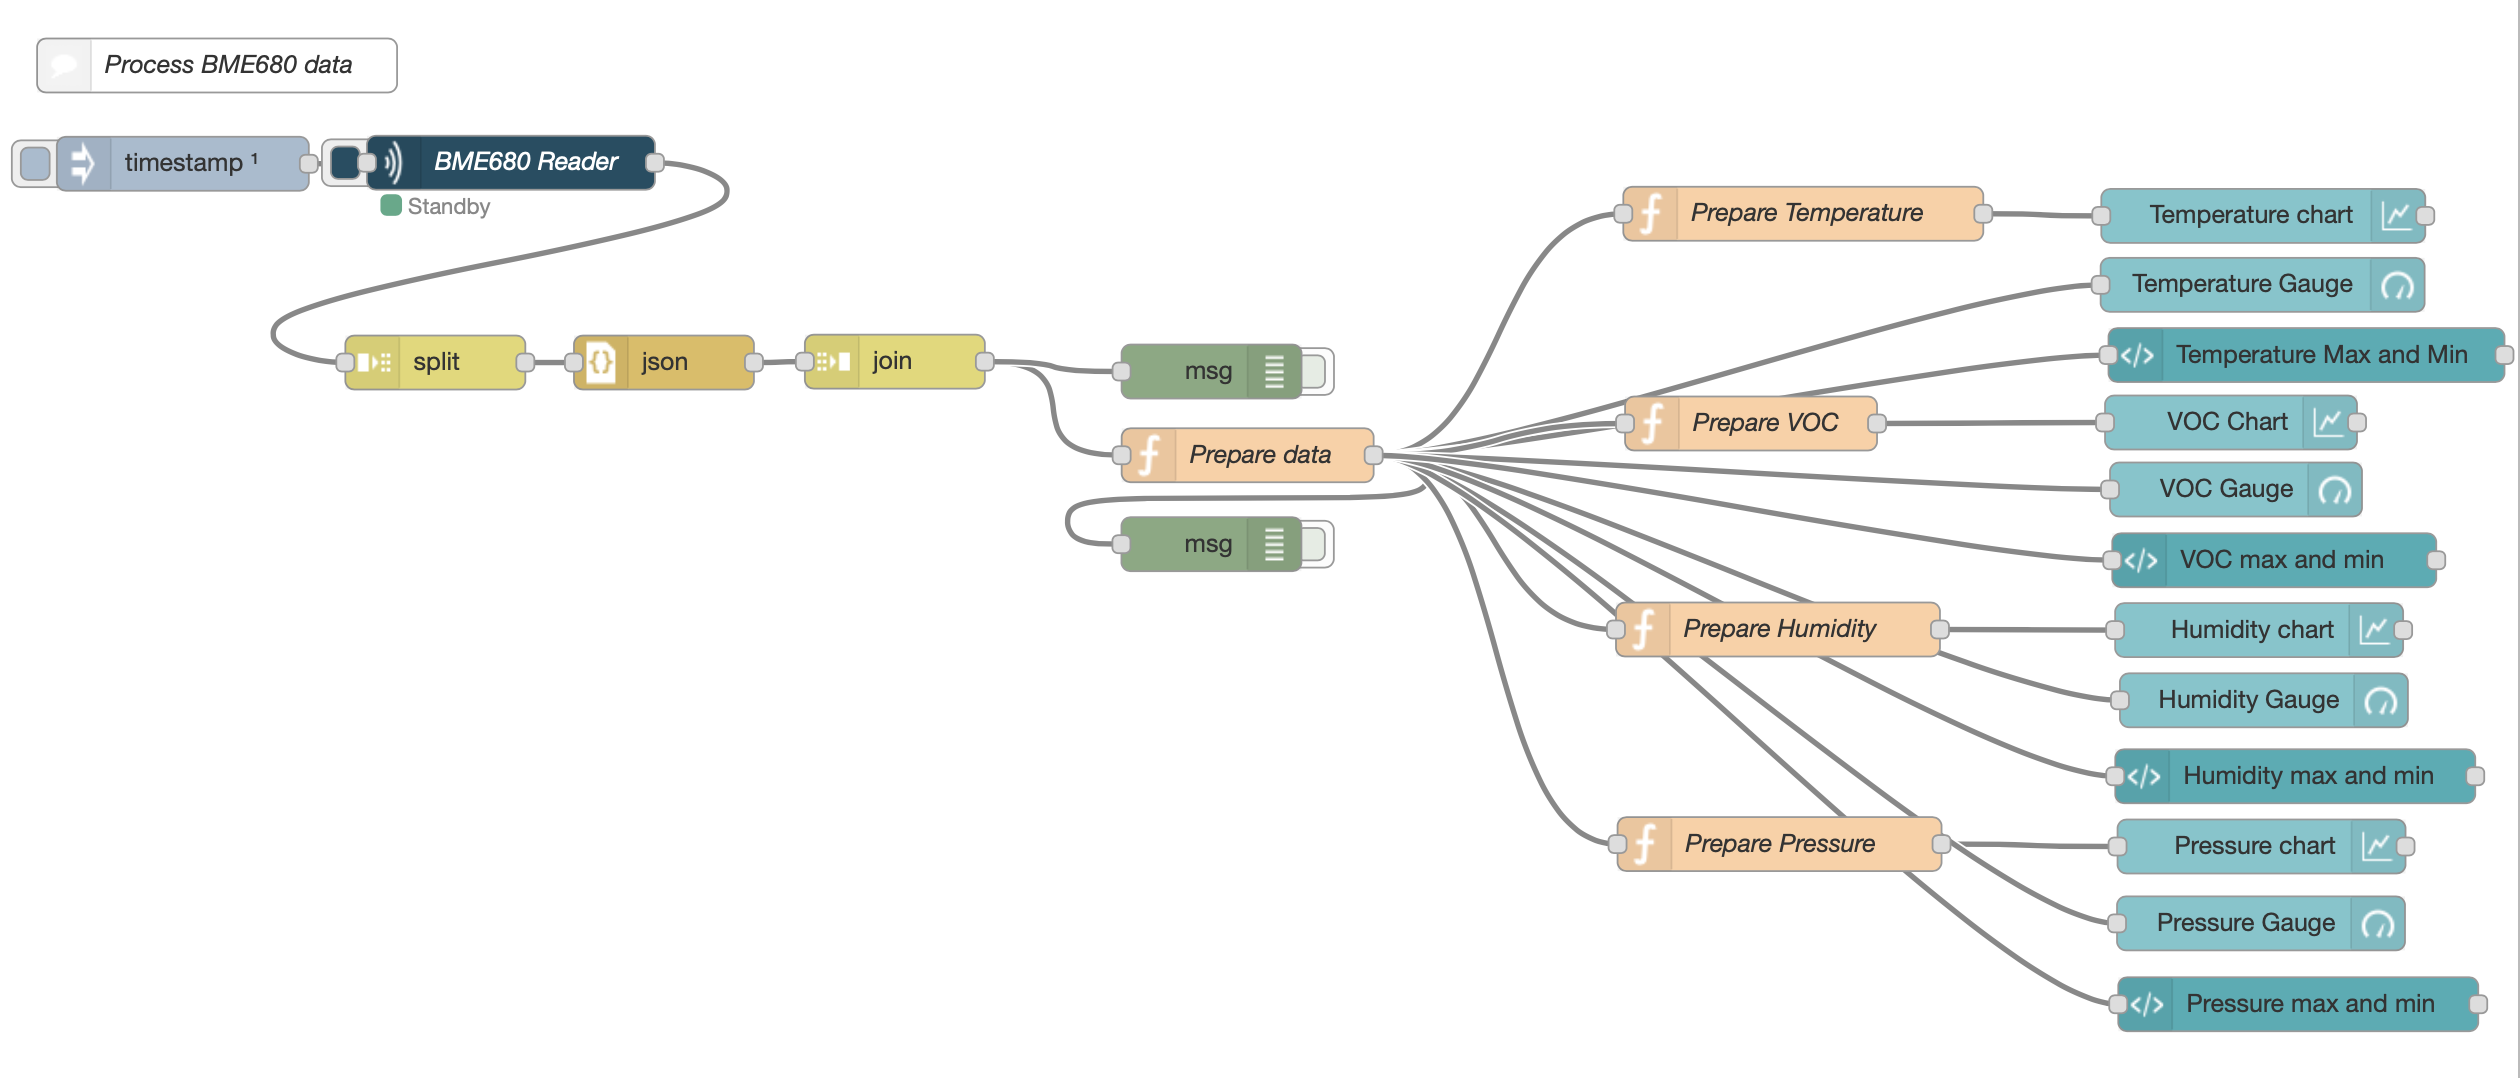
The Node-red : json ‘palette’ should be installed, but if not that needs installing. Next we built flow (script) to obtain the data, which it does by running the Python script, and then formatting the output into a NodeRED dashboard. When complete the flow looked like this:
The NodeRed Pallette (installed modules) will need updating – adding ‘node-red-contrib-pythonshell‘ and ‘node-red-dashboard‘.
In NodeRED, the flow itself can be saved off to a JSON text file, and used to recreate the flow. The exported code for this was as follows (this can be imported to a new flow):
[{"id":"5fd30172.4d4c58","type":"ui_chart","z":"d551e5.6a5cfe18","name":"Humidity Chart (%)","group":"a7a0d7.6c039f28","order":1,"width":"17","height":"4","label":"","chartType":"line","legend":"false","xformat":"HH:mm:ss","interpolate":"linear","nodata":"","dot":false,"ymin":"","ymax":"","removeOlder":1,"removeOlderPoints":"","removeOlderUnit":"3600","cutout":0,"useOneColor":false,"colors":["#1f77b4","#aec7e8","#ff7f0e","#2ca02c","#98df8a","#d62728","#ff9896","#9467bd","#c5b0d5"],"useOldStyle":false,"outputs":1,"x":1306.1944618225098,"y":493.38890838623047,"wires":[[]]},{"id":"a7a0d7.6c039f28","type":"ui_group","z":"","name":"Humidity (%)","tab":"6c90afc.b3623d","order":4,"disp":true,"width":"17","collapse":false},{"id":"6c90afc.b3623d","type":"ui_tab","z":"","name":"BME680","icon":"dashboard","order":2,"disabled":false,"hidden":false}]
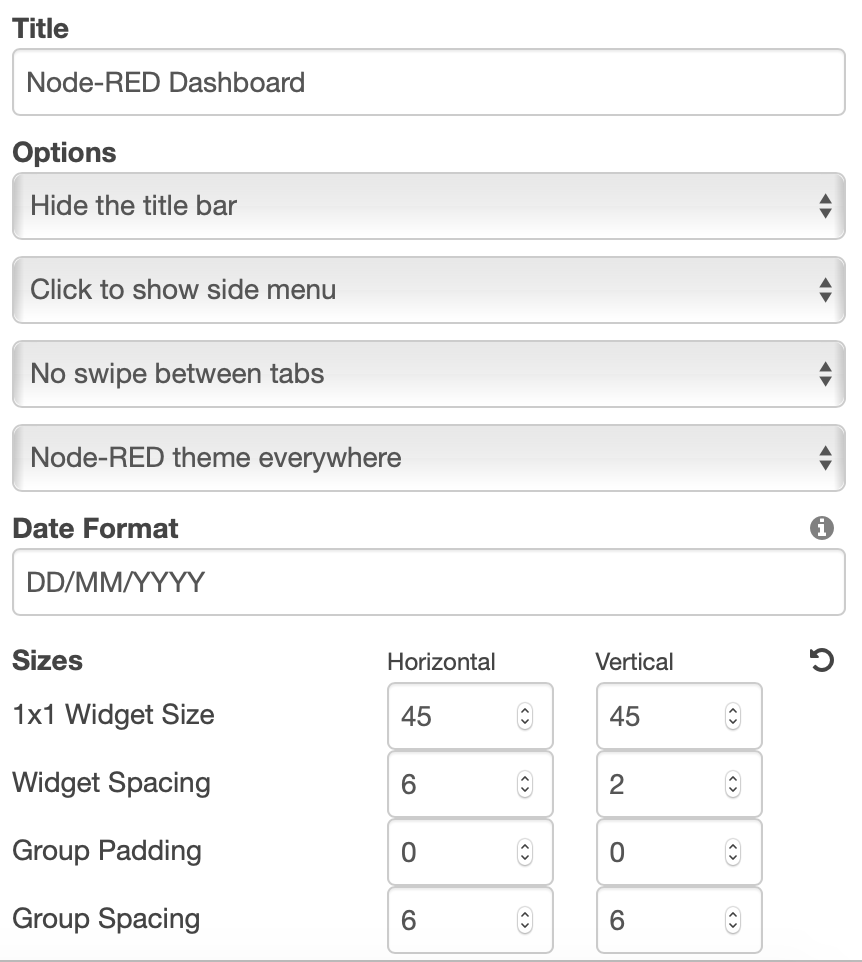
Some final configuration of the dashboard settings was required to ensure the dashboard items all fitted onto the screen. The final settings used are shown below. Note that the settings depend on the monitor/TV used (we intend to use Raspberry Pi’s own 7 inch monitor in the exhibition):
Configuring Kiosk mode for the dashboard
The final requirement was to enable the Pi to boot from cold and run the dashboard. The dashboard is a web page, and we can use the Pi’s own Chromium browser in ‘kiosk’ mode to do this. To set the dashboard up, we followed the excellent tutorial ‘Raspberry Pi Kiosk using Chromium’ at https://pimylifeup.com/raspberry-pi-kiosk/.
In summary, we first added some useful tools to the Pi (sudo apt-get install xdotool unclutter sed), then enabled autologin using rasps-config, and then created a script to run the dashboard, ‘/home/pi/kiosk.sh’, (see article linked above) thus:
#!/bin/bash
 xset s noblank
 xset s off
 xset -dpms
 unclutter -idle 2 -root &
 sed -i 's/"exited cleanly":false/"exited_cleanly":true/' /home/pi/.config/chromium/Default/Preferences
 sed -i 's/"exit_type":"Crashed"/"exit_type":"Normal"/' /home/pi/.config/chromium/Default/Preferences
 /usr/bin/chromium-browser --noerrdialogs --disable-infobars --kiosk http://localhost:1880/ui
We then set up a service file (editing as root), ‘sudo nano /lib/systemd/system/kiosk.service’ as follows:
[Unit]
  Description=Chromium Kiosk
  Wants=graphical.target
  After=graphical.target
[Service]
  Environment=DISPLAY=:0.0
  Environment=XAUTHORITY=/home/pi/.Xauthority
  Type=simple
  ExecStart=/bin/bash /home/pi/kiosk.sh
  Restart=on-abort
  User=pi
  Group=pi
[Install]
  WantedBy=graphical.target
Finally, we could test the service started (sudo systemctl start kiosk.service) and stopped (sudo systemctl stop kiosk.service), before configuring it to run from boot (sudo systemctl enable kiosk.service). We checked the status was good (sudo systemctl status kiosk.service).
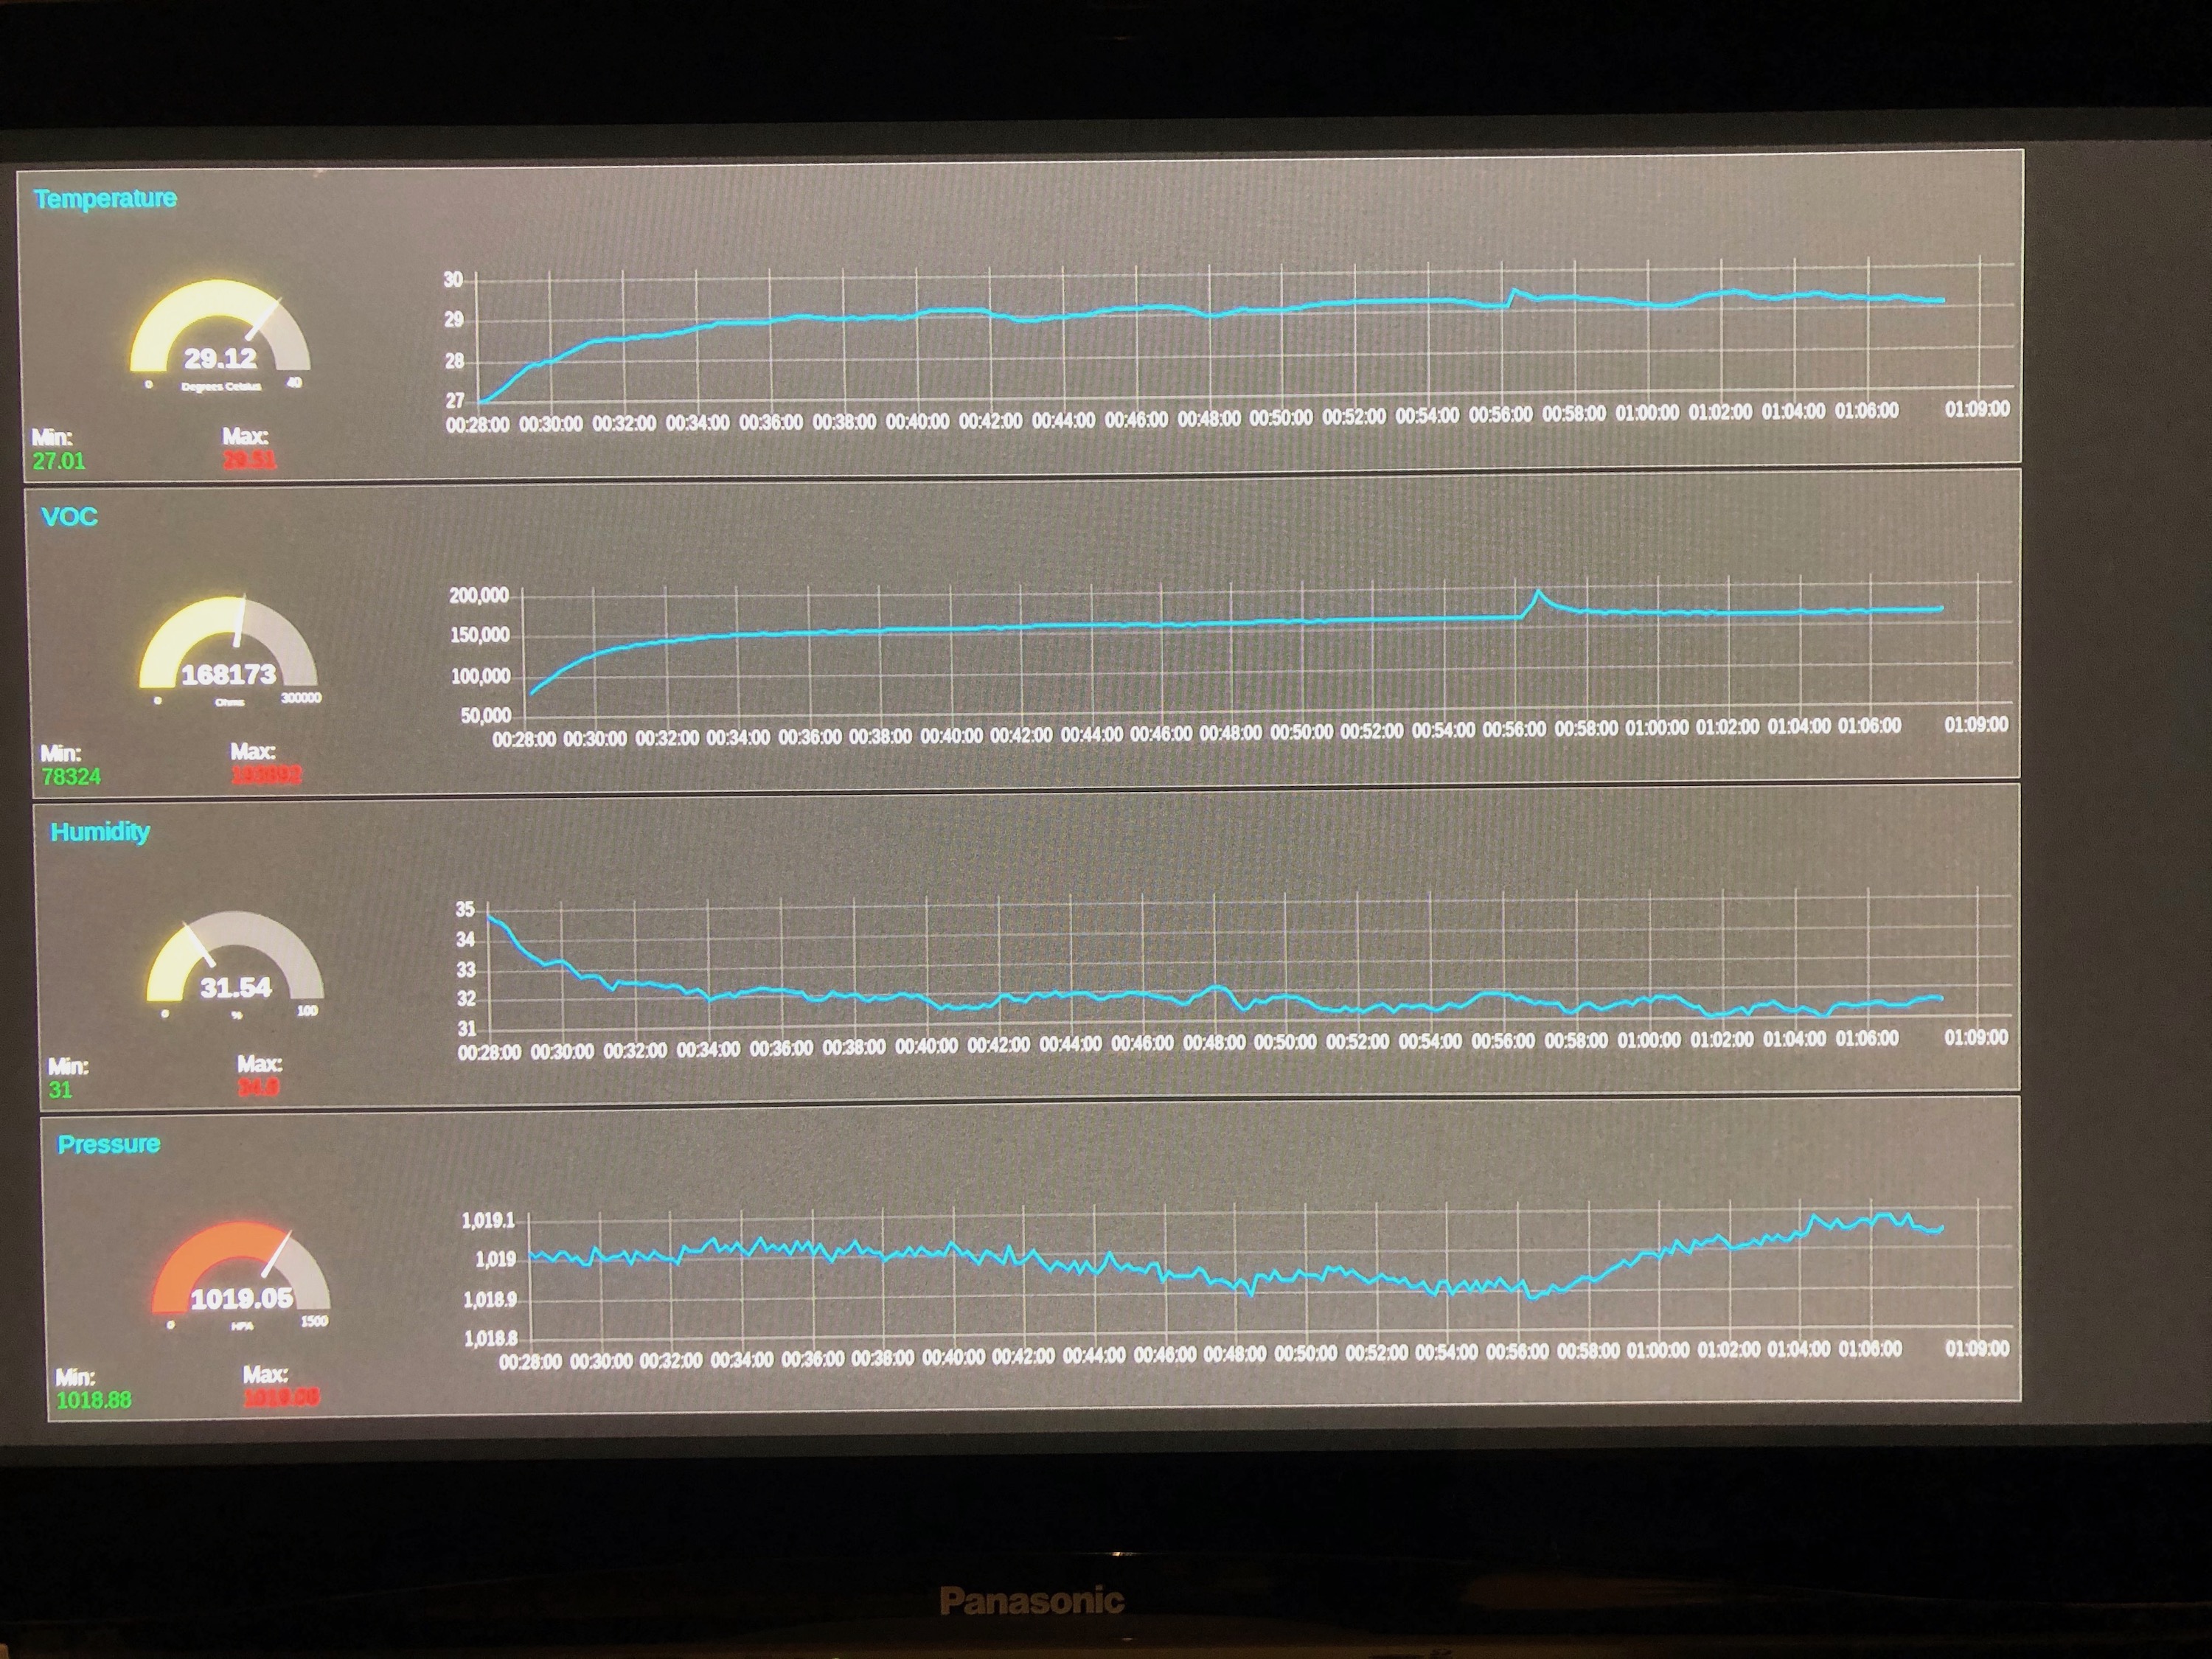
Then we can reboot the Pi and the dashboard appears (takes a while to appear).
Epilogue
We wanted to have a demonstrator for an exhibition that could run unattended, did not need network connections, and showcased the use of the Raspberry Pi as a means to collect and display environmental data. This configuration works well and shows what a versatile computer the Pi really is. In designing the dashboard, there were inevitably lots of editing required. We discovered that with the Pi connected to a monitor as configured above, the best means to do this was to connect with a separate networked laptop to the NodeRED configuration page on the Pi (<<IP address of Pi>>:1880) – then, then the code is redeployed, or the dashboard rebuilt – the attached monitor display automatically updates. This saved a LOT of time.
For the exhibition itself, the Pi can now be plugged in and powered up and should immediately start working. A ‘power down’ halt button – has been added at the foot of the dashboard, as it is generally not advised to turn off a Pi by just pulling the plug!! If we are running without a mouse or keyboard, but using the Raspberry Pi screen, which is a touchscreen, a further ‘touch’ setting needs to be added to the call to Chromium, thus: (/usr/bin/chromium-browser –touch-events –noerrdialogs –disable-infobars –kiosk http://localhost:1880/ui).
]]>