Cranfield University recently received a NERC (Natural Environment Research Council) Big Data Capital Equipment Award (NE/LO12774/1) which provided for a state-of-the-art virtual reality suite comprising of a 3D projection system. This award also included a 3D software package called Geovisionary.
Geovisionary allows users to display a range of environmental, soils, topographical, geological and other geospatial data within a 3D environment. 3D models, for example, Google Sketchup models within Google Earth can also be imported in their native (.dae) format. It has particular appeal when disseminating and analysing environmental information and sets itself apart from other established software in that it allows the digitisation of features into 3D space.
Following ongoing research by the Cambridgeshire Geology Club and their Cambs Geosites Team (www.cambridgeshiregeologyclub.org), Cranfield were asked to produce and subsequently present 3D models of the Fenland edge landscape of Cambridgeshire. The Fen-edge is widely regarded as being the maximum limit of peat development, often indicative of the land between the 5 and 10m Ordnance Survey contours.
[caption id="attachment_674" align="alignright" width="268"]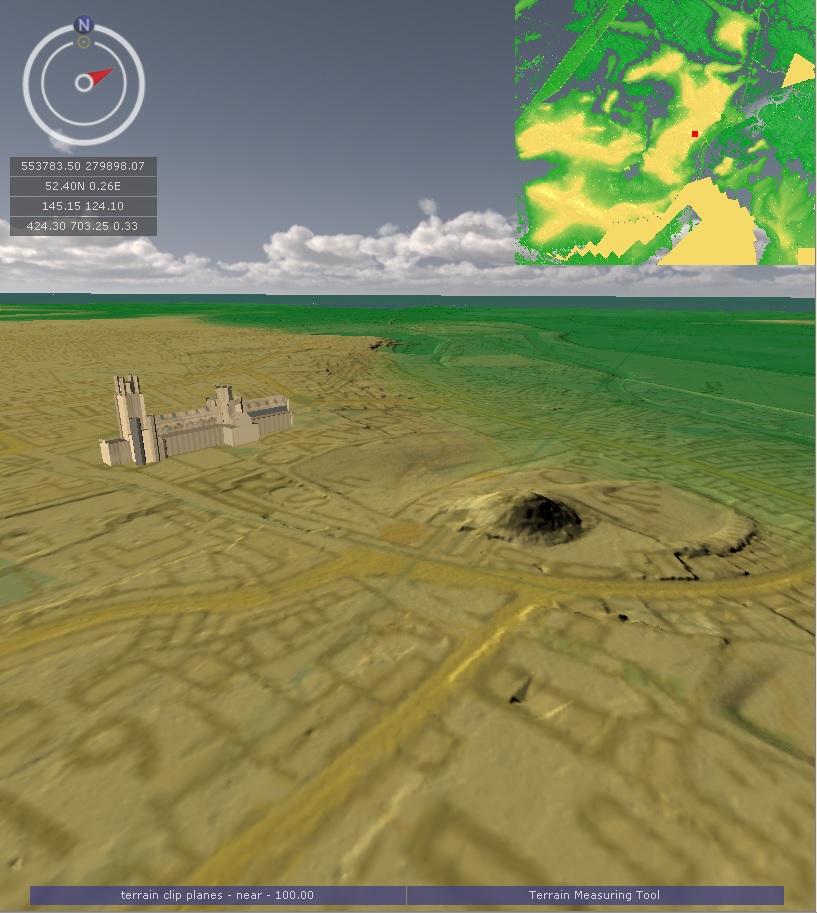 3D computer visualisation representation of the Cambridgeshire Fens in the GeoVisionary software suite.[/caption]The fenland landscape has extremely subtle topography, with topographic highs struggling to reach 35-40m AOD. Therefore, a high-resolution digital elevation model was required for the analysis, as the Ordnance Survey’s open-source Terrain 50 and Panorama datasets couldn’t represent the landforms that were often only 10’s cm in height. Digital terrain models (DTM) for three case-study areas (Warboys, Whittlesey and Ely) were therefore produced using airborne LiDAR data provided by the Environment Agency’s Geomatics group. Data was initially provided in 2km grids in ESRI’s ASCII file format at 1m pixel resolution, as this represented the best data coverage of the areas. ArcGIS (v.10.2) was used to convert the ASCII format data into a raster format. The 2km2 raster tiles were then mosaiced to create a continuous surface for the three case-study areas.
With Geovisionary having its own file format (.vsi), a dedicated VSI converter, provided with the software was used to reformat the raster-based DTM so that it can be read into Geovisionary. The same applies to other geospatial layers which are imported into the model.
Ordnance Survey 1:25,000 scale mapping and the British Geological Survey’s 1:50,000 scale bedrock and superficial digital geology maps were draped onto the DTM in the Geovisionary environment. These datasets were sourced from Edinas DigiMap service (http://digimap.edina.ac.uk/digimap/home). The National Soil Map (NATMAP), in the custody of Cranfield University, was also draped over the DTM.
[caption id="attachment_676" align="alignright" width="300"]
3D computer visualisation representation of the Cambridgeshire Fens in the GeoVisionary software suite.[/caption]The fenland landscape has extremely subtle topography, with topographic highs struggling to reach 35-40m AOD. Therefore, a high-resolution digital elevation model was required for the analysis, as the Ordnance Survey’s open-source Terrain 50 and Panorama datasets couldn’t represent the landforms that were often only 10’s cm in height. Digital terrain models (DTM) for three case-study areas (Warboys, Whittlesey and Ely) were therefore produced using airborne LiDAR data provided by the Environment Agency’s Geomatics group. Data was initially provided in 2km grids in ESRI’s ASCII file format at 1m pixel resolution, as this represented the best data coverage of the areas. ArcGIS (v.10.2) was used to convert the ASCII format data into a raster format. The 2km2 raster tiles were then mosaiced to create a continuous surface for the three case-study areas.
With Geovisionary having its own file format (.vsi), a dedicated VSI converter, provided with the software was used to reformat the raster-based DTM so that it can be read into Geovisionary. The same applies to other geospatial layers which are imported into the model.
Ordnance Survey 1:25,000 scale mapping and the British Geological Survey’s 1:50,000 scale bedrock and superficial digital geology maps were draped onto the DTM in the Geovisionary environment. These datasets were sourced from Edinas DigiMap service (http://digimap.edina.ac.uk/digimap/home). The National Soil Map (NATMAP), in the custody of Cranfield University, was also draped over the DTM.
[caption id="attachment_676" align="alignright" width="300"]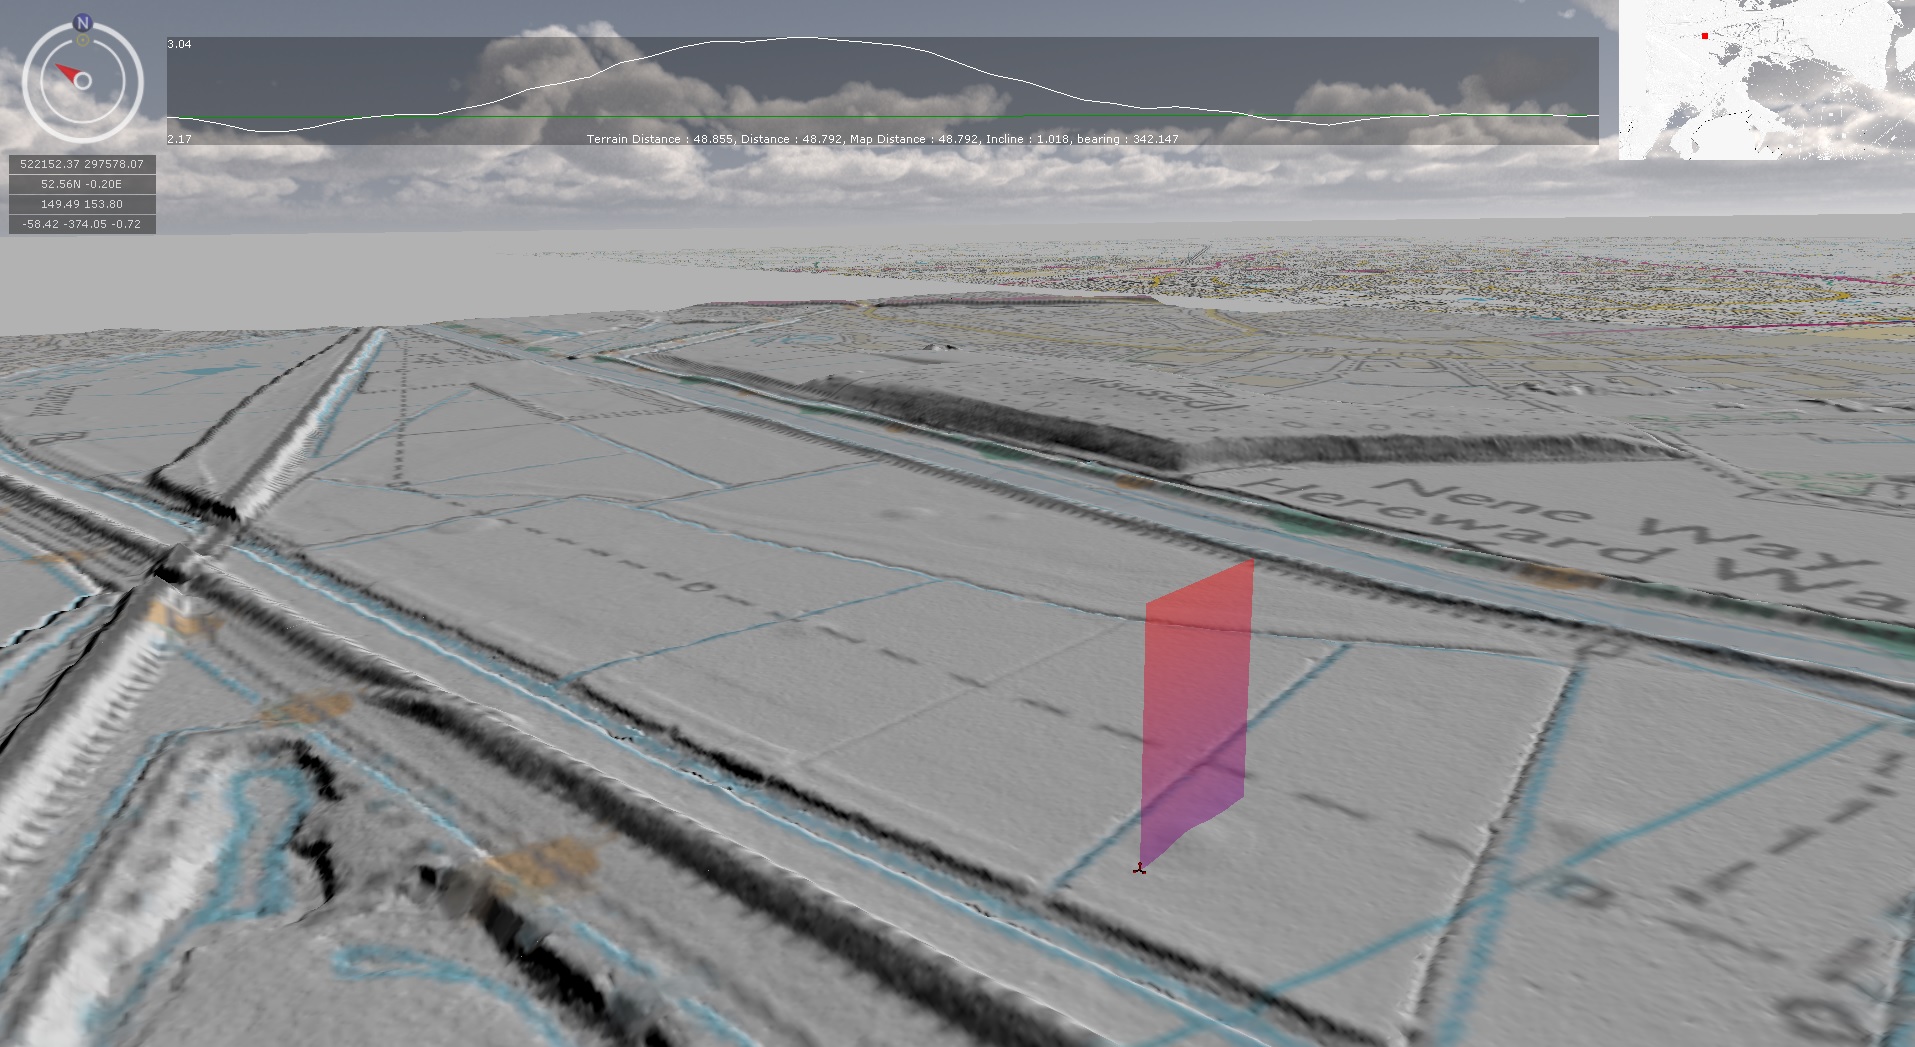 3D computer visualisation representation of a Bronze Age Barrow in the Cambridgeshire Fens in the GeoVisionary software suite.[/caption]These models were recently showcased at the Cambridgeshire Geology Club’s ‘The geology and Landscape of the Fen Edge’ seminar at the University of Cambridge in September 2014. Here, the demonstration of the 3D models to a general public audience received an engaging and encouraging response. There is a significant advantage to using 3D visualisation software to communicate complex geomorphological and geological histories of the Cambridgeshire Fenlands to both the non-specialist and the specialist alike.
]]>
3D computer visualisation representation of a Bronze Age Barrow in the Cambridgeshire Fens in the GeoVisionary software suite.[/caption]These models were recently showcased at the Cambridgeshire Geology Club’s ‘The geology and Landscape of the Fen Edge’ seminar at the University of Cambridge in September 2014. Here, the demonstration of the 3D models to a general public audience received an engaging and encouraging response. There is a significant advantage to using 3D visualisation software to communicate complex geomorphological and geological histories of the Cambridgeshire Fenlands to both the non-specialist and the specialist alike.
]]>
Cranfield University GeoThread Blog