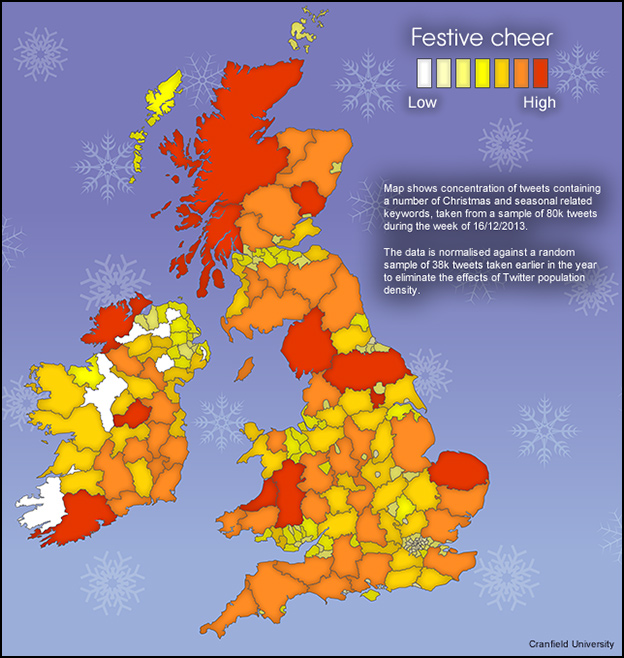
Cranfield University, here’s fun little map we’ve put together. Using the twitter4j Java library and the Twitter API, we collected a sample of 80,000 geotagged tweets over a three day period this week that matched a short list of festive and Christmas related keywords. The data was then plotted onto a map of the UK and grouped by county. The totals were then normalised against a random sample of 38,000 tweets, also grouped by county, that were collected earlier in the year. This removed the effect of Twitter population density, leaving the concentration of Christmas tweets in relation to that county’s normal levels of Twitter activity.
The Highlands, Cumbria, North Yorkshire, Norfolk and central Wales certainly seem to be getting into the spirit of things. The south of England on the other hand has some catching up to do, in comparison. We should add that at no stage have we measured sentiment (good or bad), simply instances of related keywords.
Merry Christmas and a happy New Year from all at Geothread!
 ]]>
]]>
Cranfield University GeoThread Blog