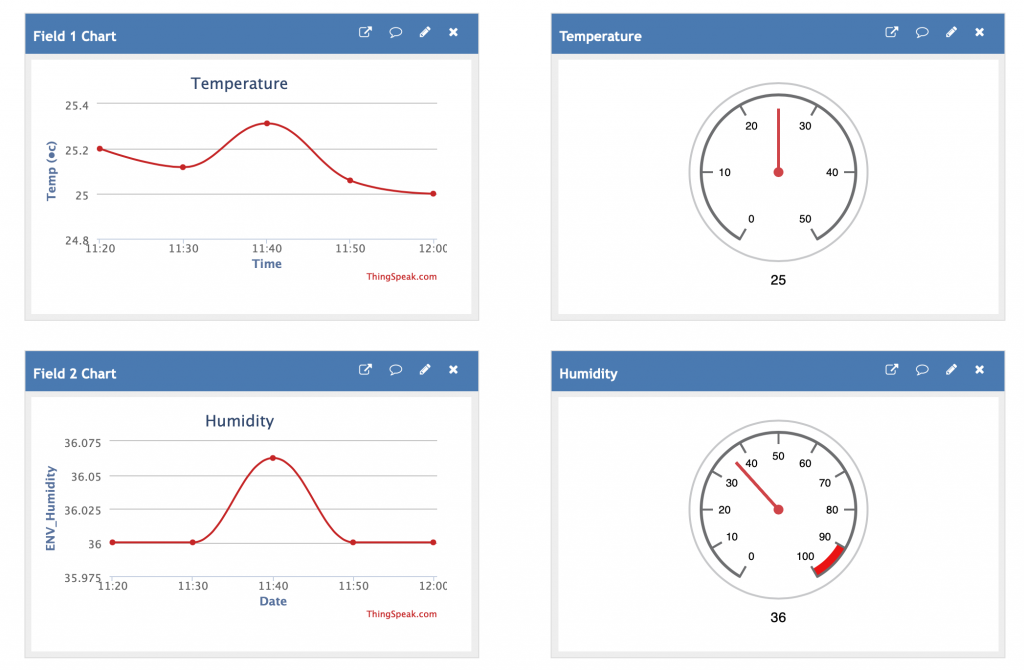
In the earlier blog, we captured sensor data from Raspberry Pi Zeros with cameras, running Kerboros, to a Postgres database. This quickly builds up a vast body of data in the database. Finding a way to present this data in a web-based dashboard will help us investigate and evaluate the experiment results.
We investigated a range of tools for presenting the data in this way. The project is already using Node.js to receive postings from the cameras using HTTP POST requests. The Node.js environment then communicates with the back-end Postgres database to INSERT new records. The same Node.js environment can also be used to serve up the results of queries made of the database in response to standard HTTP GET requests.
The Postgres database design has the following structure:
id integer NOT NULL DEFAULT [we used the data type SERIAL to outnumber records, and set this field as the Primary Key]
"regionCoordinates" character varying(30)
"numberOfChanges" integer
incoming integer
outgoing integer
"timestamp" character varying(30)
microseconds character varying(30)
token integer
"instanceName" character varying(30)
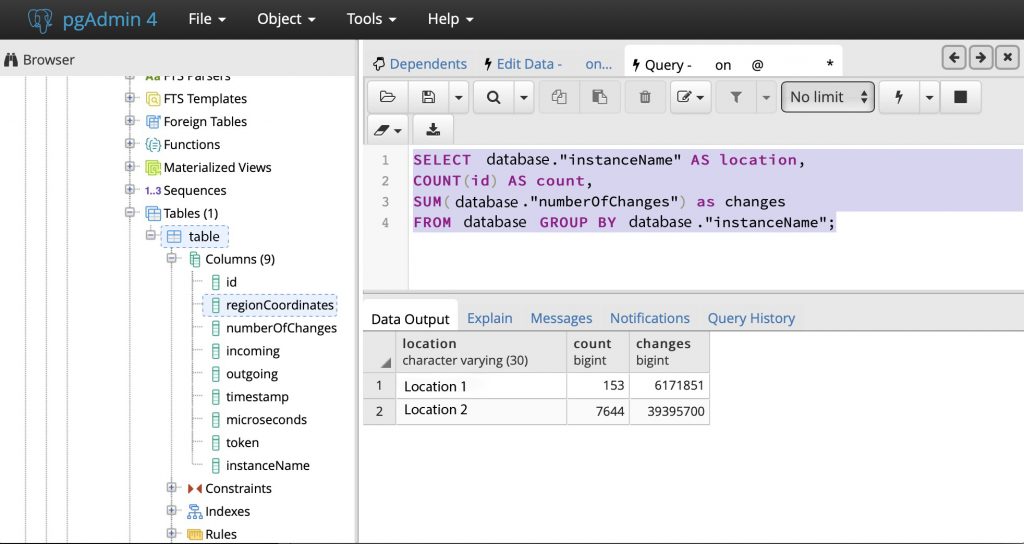
An SQL query to extract summary data for a simple results table is, for example:
SELECT database."instanceName" AS location,
  COUNT(id) AS count,
  SUM(database."numberOfChanges") as changes
FROM database
GROUP BY database."instanceName"
Note the use of the single quotation marks around names having mixed case (e.g. ‘”instanceName”). Using pgAdmin to access Postgres, this query produces an output as follows:
So with this query and data output, we have the data we need for a simple report. Next we need to build a web page using Node.js. We are already using Express, the lightweight web server. However, a powerful addition is a JavaScript HTML templating engine. Of the many on offer, we like pug, it is a high-performance template engine, implemented with JavaScript for Node.js and browsers, and has a clean and compact approach. We first need to install pug on the server with node present.
# The node app should be stopped
sudo systemctl stop node-api-postgres.service

# Update npm itself if required
sudo npm install -g npm

# Install JavasScript template engine 'pug'
npm i pug

# We may then need to rebuild the app dependencies
npm rebuild
With pug installed, we can update the Node.js scripts built in the earlier blog. First index.js:
index.js
!/usr/bin/env node
// index.js
const express = require('express')
const bodyParser = require('body-parser')
const pug = require('pug')
const app = express()
const db = require('./queries')
const port = 3000

app.use(bodyParser.json())
app.use(
  bodyParser.urlencoded({
    extended: true,
  })
)
app.set('views','views');
app.set('view engine', 'pug');

app.get('/', (request, response) => {
  response.send('Footfall counter - Service running')
  console.log('Footfall counter - Service enquiry received')
})

app.post('/counter', db.createFootfall)
app.get('/stats', db.getStats)

app.listen(port, () => {
  console.log(`App running on port ${port}.`)
})
Note in index.js the app settings. app.set views tells pug where the templates will be stored for generating the web page. app.set. engine tells Node.js to use pug to generate the content.
Note also the new REST endpoint ‘/stats’ introduced with an HTTP GET request (app.get), and is associated with the Node.js function getStats in the associated queries.js module (file).
queries.js
// queries.js

const Pool = require('pg').Pool
const pool = new Pool({
   user: '<>',
   host: '<>',
   database: '<>',
   password: '<>',
   port: 5432,
})

const createFootfall = (request, response) => {
  const {regionCoordinates, numberOfChanges, incoming, outgoing, timestamp, microseconds, token, instanceName} = request.body
  pool.query('INSERT INTO <> ("regionCoordinates", "numberOfChanges", "incoming", "outgoing", "timestamp", "microseconds", "token", "instanceName") VALUES ($1, $2, $3, $4, $5, $6, $7, $8) RETURNING *', [regionCoordinates, numberOfChanges, incoming, outgoing, timestamp, microseconds, token, instanceName], (error, result) => {
    if (error) {
      console.log(error.stack)
    }
    console.log(`Footfall added with the ID: ${result.rows[0].id}`)
    response.status(200).send(`Footfall added with ID: ${result.rows[0].id}\n`)
  })
}

const getStats = (request, response) => {
  pool.query('SELECT <>."instanceName" AS location, COUNT(id) AS count, SUM(<>."numberOfChanges") as changes FROM footfall GROUP BY <>."instanceName"', (error, result) => {
    if (error) {
      throw error
    }
    response.status(200).render('stats', {title: 'Footfall counter statistical reporter', rows: result.rows})
  })
}

module.exports = {
  createFootfall,
  getStats,
}
Note in queries.js the definition of the function getStats. This function is associated with the HTTP GET request on ‘/stats’ from the earlier index.js file. The function returns a status of ‘200’ and then calls the pug render function with a couple of parameters, first the title of the resultant web page we want, and then more importantly the recordset (‘rows’) resulting from the SQL query – the entire object is passed through. Lastly, getStats is added to the module exports at the end of the file.
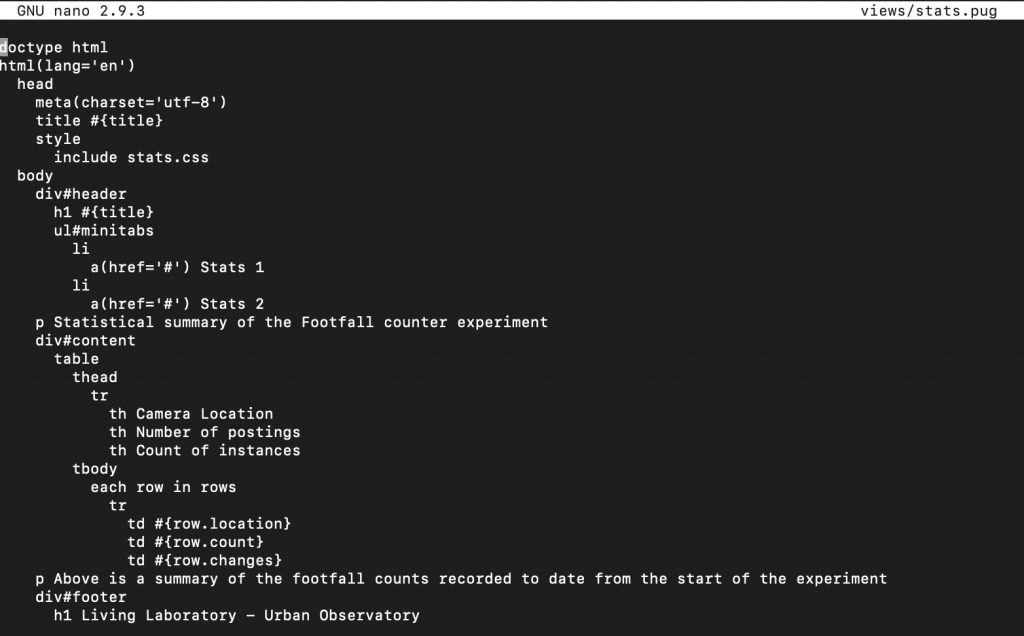
Next we have to set up the pug template and style sheet used to generate the HTML file output. Note we defined the folder ‘views’ to hold these files in ‘index.js’. We create a new folder called ‘views’ and create a pug template file called ‘stats.pug’. Pug files all have the extension ‘.pug’.
stats.pug
doctype html
html(lang='en')
  head
    meta(charset='utf-8')
    title #{title}
    style
      include stats.css
  body
    div#header
      h1 #{title}
      ul#minitabs
        li
          a(href='#') Stats 1
        li
          a(href='#') Stats 2
    p Statistical summary of the Footfall counter experiment
    div#content
      table
        thead
          tr
            th Camera Location
            th Number of postings
            th Count of instances
        tbody
          each row in rows
            tr
              td #{row.location}
              td #{row.count}
              td #{row.changes}
    p Above is a summary of the footfall counts recorded to date from the start of the experiment
    div#footer
      h1 Living Laboratory - Urban Observatory
The pug template has a particular markup format that is used. This takes a bit of getting used to, but does result in a clean document ready for rendering down into HTML for return to the HTTP request. Node the way the parameters are integrated into the page, firstly the page title, and then the expression of the recordset as a variable length table, using a ‘for each’ type structure to iterate the recordset. Note lastly the use of the ‘insert’ directive to include the CSS file into the HTML. The file ‘stats.css’ looks like this:
stats.css
/* Example CSS Document - Screen version */

/* Screen partitions */
#header {
  padding: 5px;
  }

#content {
  float: right;
  padding: 5px;
  width: 100%;
  }

#footer {
  clear: right;
  padding: 5px;
  }

/***************************/

/* Top Menu definition */
#minitabs {
  margin: 0;
  padding: 0 0 20px 0;
  font-family: Arial, sans-serif;
  font-size: 15px;
  border-bottom: 1px solid #ffcc00;
  }

#minitabs li {
  margin: 0;
  padding: 0;
  display: inline;
  list-style-type: none;
  }

#minitabs a {
  float: right;
  line-height: 14px;
  font-weight: bold;
  margin: 0 10px 4px 10px;
  text-decoration: none;
  color: #ffcc00;
  }

#minitabs a.active, #minitabs a:hover {
  border-bottom: 4px solid #696;
  padding-bottom: 2px;
  color: #363;
  }

/***************************/

/* Table definitions */

table {
  border-collapse: collapse;
  }

tbody {
  color: #999;
  }

th, td {
  border: 1px solid #999;
  padding: 10px;
  }

caption, th {
  font-family: Verdana, sans-serif;
  font-size: 15px;
  font-weight: bold;
  padding: 10px;
  background-color: #696;
  color: white;
  }

/***************************/

/* General text decorations */

/* Drop capital - decorative effect */
.drop {
  float: left;
  font-family: Verdana, sans-serif;
  font-size: 450%;
  line-height: 1em;
  margin: 4px 10px 10px 0;
  padding: 4px 10px;
  border: 2px solid #ccc;
  background: #eee;
  }

/* Inset box */
.inset_box {
  float: right;
  font-family: Arial, sans-serif;
  font-weight: Bold;
  color: #999;
  margin: 10px, 5px, -2.5px, 10px;
  padding: 5px;
  border: 2px solid #ccc;
  background: #eee;
  width: 30%;
  }

/* General body text definition */
body {
  font-family: Georgia, Times, serif;
  line-height: 1.3em;
  font-size: 15px;
  text-align: justify;
  display: block;
  }

.noprint {
  font-size: 20px;
  color: "#FF3333";
  }

/* All link colours */
a:link, a:vlink, a:hlink, a:alink {
  color: #ffcc00;
  }

/* Headings */
h1 {
  font-family: Arial, sans-serif;
  font-size: 24px;
  font-variant: small-caps;
  letter-spacing: 4px;
  color: #ffffdd;
  padding-top: 4px;
  padding-bottom: 4px;
  background-color: #ffcc00;
  }

h2 {
  font-family: Arial, sans-serif;
  font-size: 14x;
  font-style: Italic;
  color: #ffff99;
  padding: 0;
  background-color: #ffcc00;
  }

/* Horizontal rule */
hr {
  display: inline;
  color: #ffff99;
  }

/* Abbreviations & Acronyms */
abbr, acronym {
  border-bottom: 1px dotted;
  font-weight: Bold;
  cursor: help;
  color: #ffcc00;
  }
Not all the definitions in the CSS are used, but it is a useful set of styles. The file ‘stats.css’ is placed alongside ‘stats.pug’ in the ‘views’ folder.
At this point the Node.js app can be restarted
# The node app should be started
sudo systemctl start node-api-postgres.service
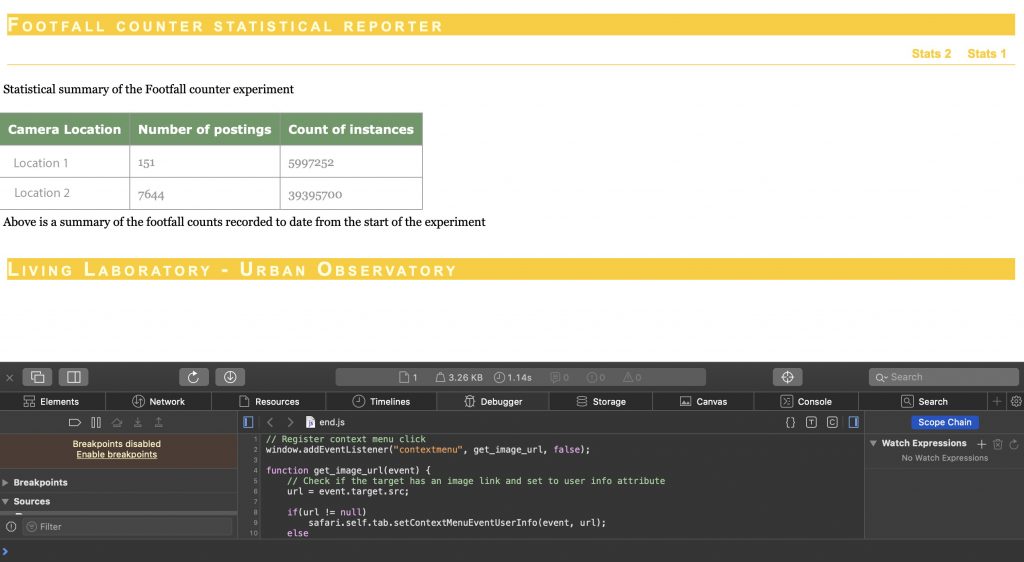
The app is up and running again, and hopefully continuing to receive data from the cameras with the HTTP POST requests arriving at the end-point ‘/footfall’. However, now, we can also point our web browser at the end-point ‘/stats’, and we should hopefully see the following simple dashboard report.
http://<>:3000/stats
Epilogue
The blog here described taking data from a Postgres database via a custom SELECT statement and using Node.js to paste data to the JavaScrip templating engine pug to prepare a simple HTML dashboard.
Future work could consider improved graphics, perhaps drawing from the graphics library D3, and its port to Node.js, d3-npm. ]]>