


Cranfield University to explore scenarios where decisions or interventions are required, and the consequences of sets of outcomes, or behaviours needs to be explored. As a result agent-based modelling, or ABM, is widely used in the social sciences and management sciences for setting out and testing hypotheses. However ABM techniques also have an application in the environmental sciences where ‘agents’ can represent natural features or processes such as water droplets falling across a landscape, or land use patterns, for example in agricultural crop rotations.
Agent-based modelling software tools
A number of agent-based modelling software tools exist, the three most popular of which are linked below.
NetLogo : http://ccl.northwestern.edu/netlogo/
Repast : http://repast.sourceforge.net/
AgentSpring, an advanced ABM tool : http://emlab.tudelft.nl/
For beginners in ABM, it is suggested that Netlogo represents the easiest tool to use to learn about this technique.
Worked example with NetLogo
To run this example you will need to install NetLogo on your PC or MacBook first. NetLogo can be obtained here.
There are many excellent tutorials online for using NetLogo, so no need to repeat here. The best tutorial to start with is included with the installed help information for the software itself.
NetLogo Sample Model Tutorial: http://ccl.northwestern.edu/netlogo/5.0/docs/tutorial1.html
In brief models identify four categories of objects: agents (or turtles); patches; links, and; observers. An embedded programming language using Logo allows customisation and conditional control over the agent objects and their behaviours – at initialisation and during the model run itself. A graphical user interface allows you to control and direct the flow of a model as it progresses through ‘ticks’, e.g. time steps. The speed at which these ticks progress can be changed by the user of the model. A model window presents the agent elements on-screen, during a model run. User interface features such as slider bars, switches and buttons allow you to develop sophisticated graphical user interfaces for your model. Additional features such as graphs allow you to plot agent model data throughout a run.
An extensive sample library of fully functional models, and code snippets comes with the installation and allows you to develop your ideas quickly with NetLogo.
Presented below is a simple ‘supply and demand’ agent-based model, which allows ‘demand’ agents to query properties of ‘supply’ agents. When a supplier satisfies a demand, a link is drawn between the two agents to show the user where the connection was met. A graph shows the user the number of connections that are made over time as the model runs.
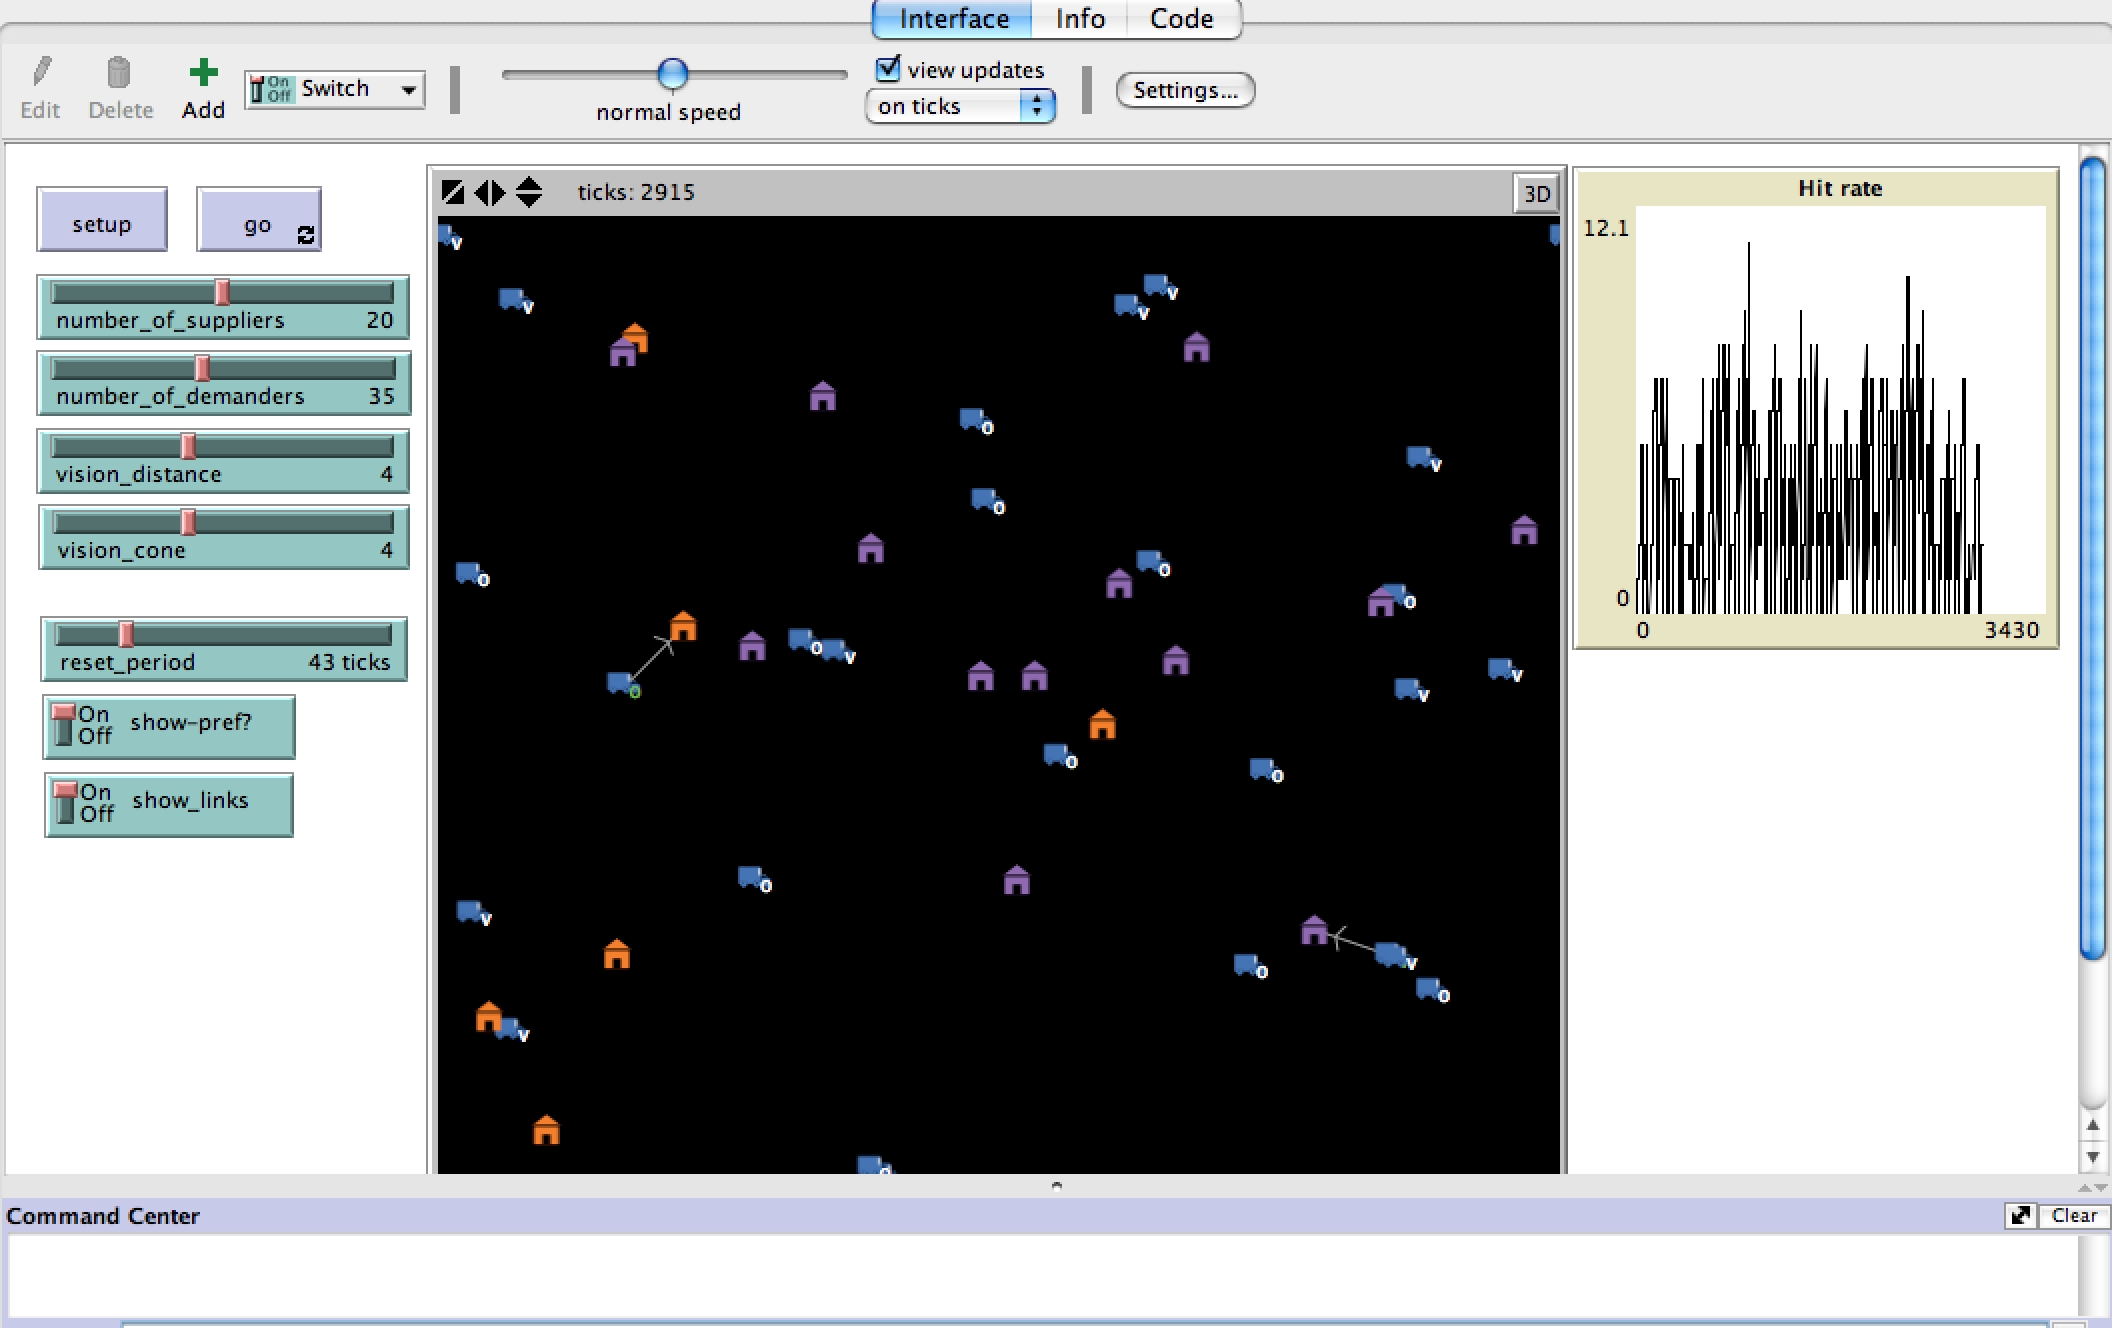 Adjacent is a screenshot from the example model, the logo code for the model is presented below.
;; Simple Supply and Demand model
;; Definition ;;;;;;;;;;;;;;;;;;;;;;;;;;;;;;;;;

breed [ demanders demand ]
breed [ suppliers supply ]

demanders-own [ ;; properties of demanders
  preference_of_supply
  visible-neighbors
  happy?
  hit_count
]

suppliers-own [ ;; properties of suppliers
  type_of_supply
]

;; Setup ;;;;;;;;;;;;;;;;;;;;;;;;;;;;;;;;;;;;;;;
to setup
  clear-all
  reset-ticks
  set-default-shape demanders "truck"
  set-default-shape suppliers "house"
  make-demanders
  make-suppliers
  if number_of_demanders > count patches [
    user-message (word "This arena only has space for "count patches" demanders.")
    stop
  ]
end

to make-demanders ;; Create demanders
  create-demanders number_of_demanders [
    set color blue
    set happy? false
    set hit_count 0
    set label-color white
    setxy random-xcor random-ycor
  ]
end

to make-suppliers ;; Create suppliers with proportions of supply type
  ( foreach [ .3 .7 ] [ orange violet ] [
    create-suppliers precision (number_of_suppliers * ?1) 0 [
        set color ?2
        fd max-pxcor - 1
        fd max-pycor - 1
      ]
    ]
  )
end

;; Run ;;;;;;;;;;;;;;;;;;;;;;;;;;;;;;;;;;;;;;;;;;
to go ;; Run
  move-demanders
  if ticks mod reset_period = 0 [ ;; Every 'n' ticks
    update-demanders-preferences  ;; update demander preferences
  ]
  tick
end

to move-demanders
  ask demanders [
    if happy? = false [ ;; and when happy remain still ...
      right random 360
      forward 1
      let _pref preference_of_supply ;; demanders properties
      let _happy false
      let _hits 0
      let _textcolor white
      ask suppliers in-cone-nowrap vision_distance vision_cone [
        ifelse _pref = color
        [ if show_links = true [
            create-link-from myself ]
          set _happy true
          set _hits ( _hits + 1 )
          set _textcolor green
        ]
        [ set _happy false
          set _textcolor white ]
      ]
      ;; Carry settings back to demanders
      set happy? _happy
      set hit_count _hits
      set label-color _textcolor
    ]
  ]
end

to update-demanders-preferences ;; split half and half each cycle
  let _label ""
  ask n-of (number_of_demanders) demanders [
    set preference_of_supply (orange)
    ifelse show-pref?
      [ set label-color white
        set label "o" ]
      [ set label "" ]
  ]
  ask n-of (number_of_demanders / 2) demanders [
    set preference_of_supply (violet)
    ifelse show-pref?
      [ set label-color white
        set label "v" ]
      [ set label "" ]

  ]
  ask demanders [ ;; Force search mode
    set happy? false
  ]
  ask links [die]
end

;; end
Finding out more
One book in particular provides a very good overview of agent-based modelling, or ABM. In particular a detailed description is given of the stepwise modelling process in Chapter 3: see
http://emlab.tudelft.nl/
Modeling Ostrom as agents:
http://jasss.soc.surrey.ac.uk/16/2/9.html
For more information
For a published example of the use of agent-based modelling techniques in exploring the energy sector, look at this paper – co-authored by Cranfield scientist, Dr L.Varga, Director of the Complex Systems Research Centre (CSRC) in the Cranfield School of Management.
Gonzalez de Durana JM, Barambones O, Kremers E, Varga L (2014) Agent based modeling of energy networks. Energy Conversion and Management, 82 () 308-319.
Acknowledgement
The authors would like to thank Dr. ir. Igor Nikolic, Assistant Professor Section Energy & Industry, at the Faculty of Technology, Policy and Management, Delft University of Technology, The Netherlands, for his kind assistance with ABM. Web: http://www.igornikolic.com]]>