esri.dijit.Legend class, which does a good job of pulling all the correct data from your map layer on ArcGIS Server and rendering a full legend on your page. However, it only offers startup(), refresh() and destroy() methods, with no way of picking the legend apart or interrogating its individual components. We figured that, in order to render the legend in HTML, ArcGIS Server must be making the information we wanted available to this class somehow.
The solution lies in the fact that ArcGIS Server makes all of this information available as part of one large layer description, in JSON format. This can be accessed over the web from your ArcGIS Server using the following URL:
http://<arcgis_server_name>/arcgis/rest/services/<folder>/<service>/MapServer/<layer>?f=json
which produces something like this
{"currentVersion":10.1,"id":0,"name":"CF1_ISISSoilMap","type":"Feature
 Layer","description":"","definitionExpression":"",
"geometryType":"esriGeometryPolygon","copyrightText":"",
"parentLayer":null,"subLayers":[],"minScale":0,"maxScale":0,
"drawingInfo":{"renderer":{"type":"uniqueValue","field1":
"Association_Symbol","field2":null,
"field3":null,"fieldDelimiter":", ","defaultSymbol":null,
"defaultLabel":null,"uniqueValueInfos":[{"symbol":{"type":"esriSFS"
...
At first this isn’t easily readable. Changing the URL parameter from f=json to f=pjson formats things a little better on the page, which helps:
http://<arcgis_server_name>/arcgis/rest/services/<folder>/<service>/MapServer/<layer>?f=pjson
{
 "currentVersion": 10.1,
 "id": 0,
 "name": "CF1_ISISSoilMap",
 "type": "Feature Layer",
 "description": "",
 "definitionExpression": "",
 "geometryType": "esriGeometryPolygon",
 "copyrightText": "",
 "parentLayer": null,
 "subLayers": [],
 "minScale": 0,
 "maxScale": 0,
 "drawingInfo": {
  "renderer": {
   "type": "uniqueValue",
   "field1": "Association_Symbol",
   "field2": null,
   "field3": null,
   "fieldDelimiter": ", ",
   "defaultSymbol": null,
   "defaultLabel": null,
   "uniqueValueInfos": [
    {
     "symbol": {
...
This might be fine for small amounts of JSON data, but still wasn’t that easy to navigate for the 3500 lines of text that was being output for the layer in question.
There are a number of excellent desktop and web based tools for making JSON data easier to read, a Google search for “JSON Viewer” will bring up a wide selection. One particular favourite of ours is http://jsonviewer.stack.hu/. Pasting the layer description data in, we were able to drill down into the various objects until we found exactly what we were looking for; the legend RGB values.
[caption id="attachment_443" align="aligncenter" width="451"] JSON visualiser[/caption]
The section we’re interested in is:
JSON visualiser[/caption]
The section we’re interested in is:
JSON.drawingInfo.renderer.uniqueValueInfos
which is an array of each of the legend items. Each object in the array contains information on the legend label, style, colour and more. The red, green and blue component values that we were after are stored as the following, respectively:
JSON.drawingInfo.renderer.uniqueValueInfos[i].symbol.color[0]
JSON.drawingInfo.renderer.uniqueValueInfos[i].symbol.color[1]
JSON.drawingInfo.renderer.uniqueValueInfos[i].symbol.color[2]
with JSON.drawingInfo.renderer.uniqueValueInfos[i].symbol.color[3] holding an opacity value. All are integers from 0-255. In the examples above, i refers to the index of a particular legend item.
Other useful legend data include:
JSON.drawingInfo.renderer.uniqueValueInfos[i].label
JSON.drawingInfo.renderer.uniqueValueInfos[i].description
You could use the data above in a live JavaScript application to interrogate ArcGIS Server on the fly. Note that you should use the f=json parameter if you do this, for performance reasons. However, in this particular instance, we wanted to extract these values into a CSV file for storage in a database elsewhere. There was one small stumbling block that needed to be overcome and that was that not all legend items contained simple block colour, some were patterned or used repeated images instead of a plain colour fill. Luckily, the JSON data helped us filter these out by providing the following:
JSON.drawingInfo.renderer.uniqueValueInfos[i].symbol.type
For block colour legend entries, this variable is set to “esriSFS”. In this particular case, we were able to ignore any entries that weren’t equal to esriSFS.
Here is the JavaScript function for producing the required CSV. Note that this example makes use of the native JSON.parse() function which doesn’t work in some older versions of IE. For full browser compatibility, the DOJO and JQuery libraries offer suitable cross-browser alternatives.
function getRGB(){
var XMLRequest = new XMLHttpRequest();
var JSONURL = "";
XMLRequest.open("GET",JSONURL,false);
XMLRequest.send();
var retrievedJSON = XMLRequest.responseText;
var retrievedObj;
retrievedObj = JSON.parse(retrievedJSON);
var myHTML = "Label,Red,Green,Blue
\n";
for (var i=0;i
With the following <div> required further down in the <body> of the page:
RGB Values to go here - something went wrong if you can see this.
The output looked something like this, which was copied and pasted into Excel for tweaking and then imported into our database.
[caption id="attachment_437" align="aligncenter" width="368"]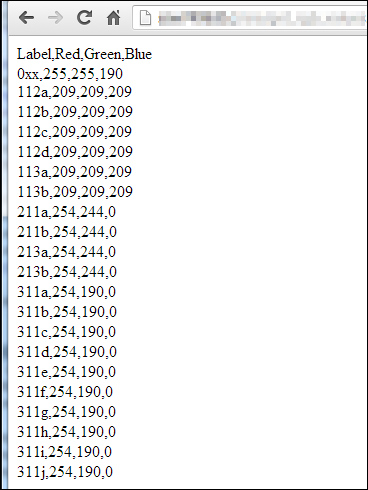 CSV data output to browser[/caption]]]>